Summary:
- Micron rallied 27.12% post-Q1 2024. At that time, I estimated the fair price to be in the range of $86-122.1.
- Micron’s high-bandwidth memories are crucial as the use of data centers for AI grows.
- Micron trails Samsung and SK Hynix but benefits from cost advantages due to vertical integration.
- Micron presents a compelling “Strong Buy” with an estimated fair price of $110.40 and a future price of $199.64. This last one suggests a 13.5% annual return throughout 2029.
JHVEPhoto
Thesis
In my previous article about Micron Technology, Inc. (NASDAQ:MU), I assigned a buy rating on Micron citing that after comparing how the stock could be affected if it performed in line with the market. In that case, Micron would have been fairly valued and at the time, the average consensus indicated a fair price of around $122.1, which was 42% higher than the stock price at that time of $86. After this article, which was released after Q1 2024, released on December 20, the stock rallied by 27.12%. This demonstrates that the stock possesses sufficient momentum to achieve high increases in the stock price.
In this article, I will update my model following Q2 2024 earnings, which were released on March 21. After concluding the valuation process, I reached a fair price of $151.72, which is 37.4% higher than the current stock price of $110.40. This means that the stock still has a huge upside to realize. Furthermore, the future stock price indicated by my model for FY2029 stands at $199.64, which implies 13.5% annual returns throughout FY2029. For these reasons, I am upgrading Micron from “Buy” to “Strong Buy”.
Seeking Alpha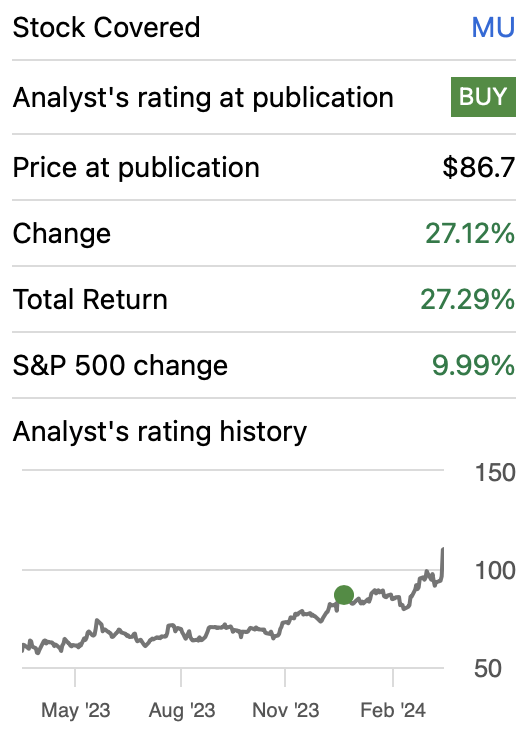
Overview
As you can see in the graph below, semiconductor shipments have recovered entirely from their contraction in 2022-2023. This is due to stabilizing inventories, and the strong adoption of AI chips.
Micron does not make AI GPUs or CPUs, however, it makes high-bandwidth memories, the HBM3F. This memory can store around 24GB per 8-high cube and transfer data at 1.2 TB/s. This is necessary for data centers.
Author’s Calculations Based on WSTS
Growth Plans
Micron identifies memory as crucial for everything related to computers and that it’s required to grow the data economy. They plan to invest more than $150 billion in manufacturing and R&D over the next decade.
How does Micron Compare against Peers?
The DRAM market is dominated by three huge players: Samsung Electronics Co., Ltd. (OTCPK:SSNLF), which holds 38.9% of the market, SK Hynix, with 24.3% and lastly, Micron, which holds 22.8%, much less than others two.
In the NAND market, we can observe the same thing, since Samsung has a 31.4% market share, followed by Kioxia with 21.5%, and Western Digital Corporation (WDC), with a 15.2% market share. Micron comes in fourth place with a market share of around 10.3%.
Lastly, the crucial question is whether Micron’s products are better than the competition. The simple answer is, in any way. There is very little differentiation between memory manufacturers aside from the price they can offer. This means that memory manufacturers need to strike up deals with PC manufacturing companies and data center companies to increase their sales. Micron’s advantage in pricing comes as it’s vertically integrated, and therefore it can save costs in designing and manufacturing. That’s why Micron’s growth plan is to invest in R&A and manufacturing, to keep this advantage.
Industry Outlook
The DRAM market has a value of $96.99 billion in 2022, and it’s expected to grow at a CAGR of 2.98% until it reaches a valuation of $126.23 billion in 2031. Meanwhile, the global NAND memory market is expected to grow from 2021’s 67 billion at a CAGR of 6.39% until it reaches the projected 2030 size of 117 billion. Combined, this means that in 2030, Micron will have an addressable market of 239.68 billion in 2030.
Headwinds
The memory industry’s main headwind is related to the semiconductor cycle. However, as you saw in the graph about worldwide semiconductor shipments, you can observe that this has ended and shipments are rising. The main driver here is the increased demand for AI data centers which require Micron’s high-bandwidth memory, and therefore, Micron will see an increase in its sales.
Valuation
In this article, I will value Micron with a DCF model. In the table of assumptions below you can find all the current financial data that is necessary to calculate the WACC. For Micron, the WACC came out at 12.21%. Furthermore, CapEx and D&A are agents to be calculated throughout the projection with the t margin tied to revenue, which means that if revenue increases, both of these variables will increase.
| TABLE OF ASSUMPTIONS | |
| (Current data) | |
| Assumptions Part 1 | |
| Equity Market Price | 121,260.00 |
| Debt Value | 14,315.00 |
| Cost of Debt | 3.66% |
| Tax Rate | 7.22% |
| 10y Treasury | 4.281% |
| Beta | 1.44 |
| Market Return | 10.50% |
| Cost of Equity | 13.24% |
| Assumptions Part 2 | |
| CapEx | 6,202.00 |
| Capex Margin | 33.87% |
| Net Income | -3,767.00 |
| Interest | 524.00 |
| Tax | -434.00 |
| D&A | 7,646.00 |
| Ebitda | 3,969.00 |
| D&A Margin | 41.75% |
| Interest Expense Margin | 2.86% |
| Revenue | 18,312.0 |
The first step is predicting revenues. To do this, I made a table with the quarterly evolution of the Worldwide Semiconductor Shipments adjusted to Micron’s fiscal quarters. Then I made a comparison with Micron’s quarterly revenue and I found three things:
1)The difference between Micron’s average variance and that of the semiconductor shipments is that Micron contracts 12.23% during downturns, and grows 5.90% more during uptrend.
2) The semiconductor shipments since Q1 2019 (corresponding to Micron’s financial calendar) grew by 5.50% during the uptrend and contracted 8.95 on average during a downtrend.
3) The pattern is usually three-quarters of growth and one of contraction. The only exception is the year 2022 when shipments (and consequently Micron’s revenue) contracted during three quarters.
With this in mind, I projected semiconductor shipments up to FY2029 and used the 12.23% difference during contraction and 5.90 during growth to project Micron’s revenue.
| Revenue Change % | Global Semiconductor Shipments | Worldwide Semiconductor Shipments | Micron’s Revenue | Difference | |
| Q1 2019 | 114,658,450 | 7,910.0 | 0.00% | ||
| Q2 2019 | -39.57% | -14.66% | 97,852,005 | 5,144.0 | -24.91% |
| Q3 2019 | 7.08% | 0.73% | 98,569,915 | 4,780.0 | 6.34% |
| Q4 2019 | 1.88% | 8.93% | 107,372,372 | 4,870.0 | -7.05% |
| Q1 2020 | 5.63% | 1.06% | 108,512,684 | 5,144.0 | 4.56% |
| Q2 2020 | -6.88% | -3.64% | 104,559,994 | 4,790.0 | -3.24% |
| Q3 2020 | 13.36% | -1.09% | 103,423,423 | 5,430.0 | 14.45% |
| Q4 2020 | 11.53% | 9.77% | 113,526,265 | 6,056.0 | 1.76% |
| Q1 2021 | -4.67% | 4.72% | 118,879,676 | 5,773.0 | -9.39% |
| Q2 2021 | 8.02% | 3.75% | 123,342,793 | 6,236.0 | 4.27% |
| Q3 2021 | 19.02% | 9.09% | 134,550,392 | 7,422.0 | 9.93% |
| Q4 2021 | 11.48% | 8.09% | 145,439,210 | 8,274.0 | 3.39% |
| Q1 2022 | -7.09% | 4.90% | 152,560,119 | 7,687.0 | -11.99% |
| Q2 2022 | 1.29% | -0.53% | 151,749,147 | 7,786.0 | 1.82% |
| Q3 2022 | 10.99% | -0.82% | 150,504,175 | 8,642.0 | 11.81% |
| Q4 2022 | -23.13% | -6.31% | 141,014,238 | 6,643.0 | -16.83% |
| Q1 2023 | -38.51% | -7.23% | 130,816,634 | 4,085.0 | -31.28% |
| Q2 2023 | -9.60% | -8.65% | 119,495,617 | 3,693.0 | -0.94% |
| Q3 2023 | 1.60% | 6.03% | 126,698,303 | 3,752.0 | -4.43% |
| Q4 2023 | 7.14% | 2.92% | 130,401,630 | 4,020.0 | 4.22% |
| Q1 2024 | 17.56% | 15.21% | 150,231,146 | 4,726.0 | 2.36% |
| Q2 2024 | 23.23% | -13.20% | 130,401,630 | 5,824.0 | 36.43% |
| Q3 2024 | -3.38% | 15.21% | 150,231,146 | 5,627.0 | -18.59% |
| Q4 2024 | 11.44% | 5.50% | 158,490,489 | 6,270.7 | 5.94% |
| Q1 2025 | 11.44% | 5.50% | 167,203,911 | 6,988.1 | 5.94% |
| Q2 2025 | -21.18% | -8.95% | 152,239,161 | 5,508.0 | -12.23% |
| Q3 2025 | 11.44% | 5.50% | 160,608,900 | 6,138.1 | 5.94% |
| Q4 2025 | 11.44% | 5.50% | 169,438,787 | 6,840.3 | 5.94% |
| Q1 2026 | 11.44% | 5.50% | 178,754,119 | 7,622.9 | 5.94% |
| Q2 2026 | -21.18% | -8.95% | 162,755,626 | 6,008.4 | -12.23% |
| Q3 2026 | 11.44% | 5.50% | 171,703,534 | 6,695.7 | 5.94% |
| Q4 2026 | 11.44% | 5.50% | 181,143,377 | 7,461.7 | 5.94% |
| Q1 2027 | 11.44% | 5.50% | 191,102,200 | 8,315.3 | 5.94% |
| Q2 2027 | -21.18% | -8.95% | 173,998,553 | 6,554.1 | -12.23% |
| Q3 2027 | 11.44% | 5.50% | 183,564,570 | 7,303.9 | 5.94% |
| Q4 2027 | 11.44% | 5.50% | 193,656,504 | 8,139.5 | 5.94% |
| Q1 2028 | 11.44% | 5.50% | 204,303,268 | 9,070.6 | 5.94% |
| Q2 2028 | -21.18% | -8.95% | 186,018,126 | 7,149.5 | -12.23% |
| Q3 2028 | 11.44% | 5.50% | 196,244,950 | 7,967.4 | 5.94% |
| Q4 2028 | 11.44% | 5.50% | 207,034,020 | 8,878.9 | 5.94% |
| Q1 2029 | 11.44% | 5.50% | 218,416,247 | 9,894.6 | 5.94% |
| Q2 2029 | -21.18% | -8.95% | 198,867,993 | 7,798.9 | -12.23% |
| Q3 2029 | 11.44% | 5.50% | 209,801,272 | 8,691.1 | 5.94% |
| Q4 2029 | 11.44% | 5.50% | 221,335,636 | 9,685.4 | 5.94% |
To calculate net income, I will use the net income margins derived from the average consensus if we divide the non-GAAP Net income by the expected revenues. The results from doing this are the following:
| Net Income Margin % | |
| 2024 | 2.71% |
| 2025 | 24.36% |
| 2026 | 28.45% |
| 2027 | 21.00% |
| 2028 | 25.72% |
| 2029 | 24.70% |
| Revenue | Net Income | Plus Taxes | Plus D&A | Plus Interest | |
| 2024 | $22,447.7 | $608.33 | $652.26 | $10,025.09 | $10,549.09 |
| 2025 | $25,474.6 | $6,205.61 | $6,653.66 | $16,026.49 | $16,596.97 |
| 2026 | $27,788.6 | $7,905.86 | $8,476.67 | $20,079.54 | $20,700.62 |
| 2027 | $30,312.9 | $6,365.70 | $6,825.30 | $19,482.15 | $20,158.30 |
| 2028 | $33,066.4 | $8,504.67 | $9,118.71 | $22,925.26 | $23,661.39 |
| 2029 | $36,070.0 | $8,909.29 | $9,552.54 | $24,613.23 | $25,414.65 |
| ^Final EBITA^ |
The last step is to calculate the future price of the stock for 2029. I will do this by predicting which could be the value of each of the elements that conform to equity for 2029. For this, I will use the evolution displayed in FY2018-FY2024TTM. In that period, short-term debt decreased at a 5.5% annual pace, long-term debt increased by 52.1% annually, cash reserves grew by 5.4% annually (I will use this same figure for marketable securities), and current assets grew by 5.21% annually.
Author’s Calculations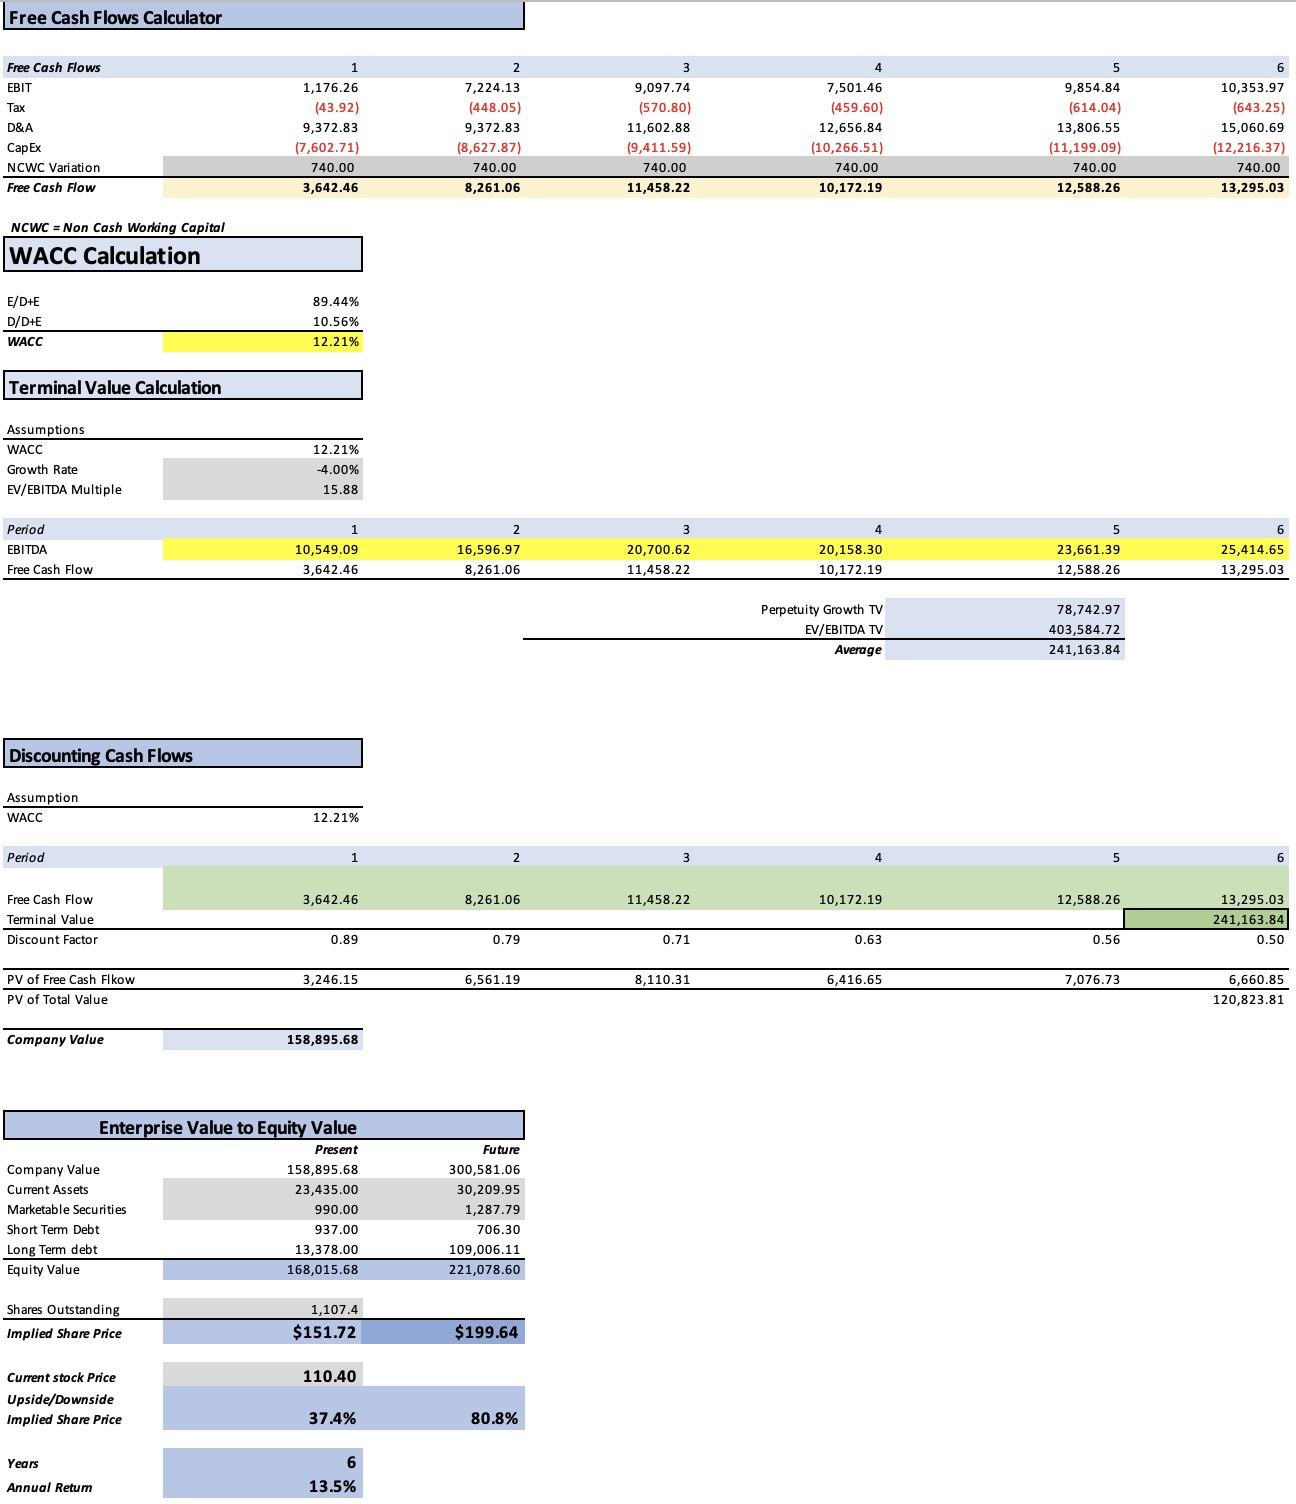
The fair stock price resulting from the DCF is $151.72, which is a 37% upside from the current stock price of $110.40. The future price is set at $199.64, which translates into annual returns of 13.5% throughout 2029. This of course could be higher in the case Micron does not increase its long-term debt by 52.1% annually.
Lastly, doing this yielded some projections for the Worldwide Semiconductor Shipments which are the following:
Author’s Calculations
How do my Results Compare with the Average Consensus?
If I were to do a model completely based on the average consensus, I would get a fair price per share of $153.16, which indicates a slightly higher upside of 38.7%. The suggested future price is $20.76, which implies 81.8% annual returns throughout 2029.
As you can see in the graph below, my estimates are lower than those of the average consensus. The difference is more pronounced for FY2025 & FY2026. This indicates that other analysts suggest that Micron’s revenue (and net income) could grow more than I expected during the upward cycle in semiconductor shipments.
Author’s Calculations
Risks to Thesis
One of the main risks of Micron’s business is that storage devices have become like a commodity, where products have different differentiation and most of the time the vendor that offers the cheapest price is the one that will get ahead of the competition. Therefore, the only way Micron can grow is by expanding the units sold to compensate for the decreasing margin or improving efficiency.
The other risk is market sentiment, which is related to my thesis because I have shown in the previous section that my estimates are lower when compared with the average consensus. However, if Micron does end up reporting lower-than-expected numbers, the stock could decline more than it should because that would be the first reaction of the market, even though the stock should increase. After all, it’s undervalued as my DCF model suggests.
Conclusion
In conclusion, Micron is well positioned in the storage market with 22.8% in DRAM and 10.3% in NAND. This is important because Micron (as well as other storage device manufacturers) rely on quantity since in this market the vendor with the lowest pricing is probably going to sell more.
Furthermore, Micron started selling High-Bandwidth memory for data centers, which have boomed recently due to the implementation of AI for machine learning, data analytics, and generative models. According to UBS, AI infrastructure spending is expected to grow at 38% until 2027. This means that Micron has an important near-term catalyst.
Lastly, Micron still offers a huge upside of around 37.4%, making it an interesting value/growth play. Additionally, the stock is poised for annual returns of around 13.5% throughout 2029, which could be higher if long-term debt increases less than the 52.1% annually I am suggesting. For these reasons, I am upgrading Micron to “Strong Buy”.
Analyst’s Disclosure: I/we have no stock, option or similar derivative position in any of the companies mentioned, but may initiate a beneficial Long position through a purchase of the stock, or the purchase of call options or similar derivatives in MU over the next 72 hours. I wrote this article myself, and it expresses my own opinions. I am not receiving compensation for it (other than from Seeking Alpha). I have no business relationship with any company whose stock is mentioned in this article.
Seeking Alpha’s Disclosure: Past performance is no guarantee of future results. No recommendation or advice is being given as to whether any investment is suitable for a particular investor. Any views or opinions expressed above may not reflect those of Seeking Alpha as a whole. Seeking Alpha is not a licensed securities dealer, broker or US investment adviser or investment bank. Our analysts are third party authors that include both professional investors and individual investors who may not be licensed or certified by any institute or regulatory body.