Summary:
- MU is inherently undervalued with a promising recovery, driven by the growing demand for AI-related memory products during the data center capex boom.
- The stock’s extremely cheap PEG non-GAAP ratio of 0.18x highlights its compelling investment thesis compared to its sector peers, despite the recent recovery.
- MU’s promising FQ1’25 guidance and the market’s long-term growth projections suggest significant upside potential, with the worst of inventory correction well behind us.
- Even so, readers may want to temper their near-term expectations, with the elevated debts and heavy capex likely to trigger stagnant dividend payouts.
- At the same time, with the market overly exuberant, a near-term correction is likely – with it potentially moderating part of MU’s recent gains.
DNY59
MU Is Inherently Undervalued – Offering Opportunistic Investors With The Dual Pronged Returns
We previously covered Micron Technology (NASDAQ:MU) in June 2024, discussing why we had maintained our Neutral rating despite the stock’s drastic pullback after the double beat FQ3’24 earnings call and promising FQ4’24 guidance.
This was attributed to the still expensive stock valuations/prices and the stock’s potential volatility attributed to the head and shoulder pattern – with it signaling a bullish-to-bearish trend reversal then.
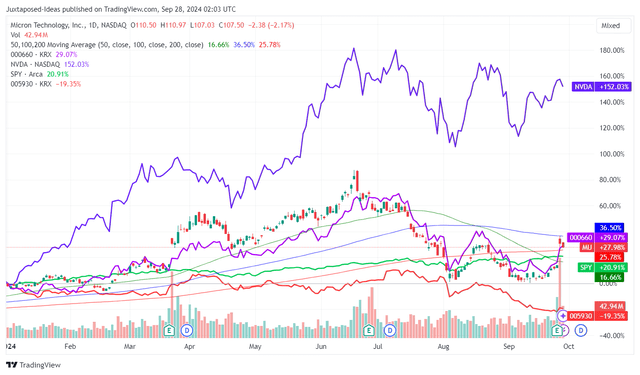
MU YTD Stock Price
Since then, MU has further retraced by -33.4% to $86s at its worst before recently rallying by +23.8%, thanks to the lifting market sentiments as the Fed pivots, significantly aided by the durable generative AI demand.
This is on top of its double beat FQ4’24 earnings call and the management’s promising FQ1’25 guidance – with it signaling that the worst of the memory correction may finally be behind us.
For context, MU reported FQ4’24 revenues of $7.75B (+13.8% QoQ / +93.2% YoY) and adj EPS of $1.18 (+90.3% QoQ / +210.2% YoY), with the demand recovery well exemplified by the expanding gross margins of 36.5% (+8.4 points QoQ / +45.6 YoY / -9.2 from FY2019 levels of 45.7%).
Much of its tailwinds are attributed to the robust demand for its data center DRAM, high bandwidth memory [HBM], and SSD sales (which exceeded $1B in quarterly revenue for the first time) – with each of the three key data center related products “to deliver multiple billions of dollars in revenue in fiscal 2025.”
This development is unsurprising indeed, given that generative AI is expected to trigger the growth in storage infrastructure from $9.02B in 2022 to $92.64B by 2032, expanding at an accelerated CAGR of +26%.
These estimates do not appear to be overly aggressive as well, since the top hyperscalers, including Amazon (AMZN), Google Cloud (GOOG), Microsoft (MSFT), and Meta (META) have guided intensified data center / AI related capex in the intermediate term.
This is also why MU has been aggressively optimizing its existing capacity by “converting lagging-edge capacity to leading-edge capacity” over the past twelve months, allowing it to capitalize on the insatiable hyperscaler demand for DRAM, HBM, and SSDs accordingly.
This explains why the management has been able to offer a highly promising FQ1’25 revenue guidance of $8.7B at the midpoint (+12.2% QoQ / +83.9% YoY), gross margins guidance of 39.5% (+3 points QoQ / +38.7 YoY), and adj EPS guidance of $1.74 (+47.4% QoQ / +283.1% YoY).
Combined with MU’s commentary on “delivering a substantial revenue record with significantly improved profitability in fiscal 2025,” it is unsurprising that the market has gotten exuberant about the memory company’s upcoming recovery.
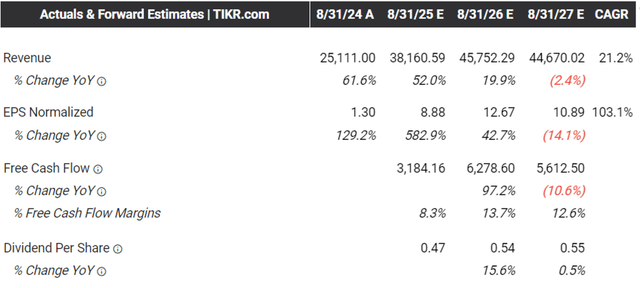
The Consensus Forward Estimates
It is unsurprising then, that the consensus already expects MU to record an accelerated recovery from the FY2023/FY2024 trough years, with a top/bottom-line growth at a CAGR of +21.2% / +103.1% through FY2027, respectively.
Otherwise, at a normalized CAGR of +8.4% / +7% between FY2019 and FY2027, respectively.
MU Valuations
And it is for these reasons that we believe MU at FWD P/E non-GAAP valuations of 12.34x does not appear to be overly expensive, compared to the sector median of 24.48x while elevated from its 3Y pre-pandemic mean of 8.25x.
This is attributed to its extremely cheap FWD PEG non-GAAP ratio of 0.18x (attributed to the trough FY2024 year), compared to the sector median of 1.93x and its 3Y pre-pandemic mean of 0.63x.
Even when compared to its memory peers, Samsung (OTCPK:SSNLF) at 0.34x and SK Hynix at 0.14x, it is undeniable that MU is extremely cheap during its upcoming path towards recovery.
With the worst of the inventory correction also well behind us, we believe that MU has finally proven itself to be a compelling growth investment thesis, thanks to the recent pullback from the June 2024 heights.
Risk Warning
One, it goes without saying that MU has been leveraging on debt to weather the painful FY2023/FY2024 trough years along with its dividend payouts, resulting in a higher net debt of -$5.29B in the latest quarter (-41.4% YoY / -351.9% from FY2019 net cash of $2.1B).
With the elevated unsold inventory levels of $8.87B (+5.8% YoY / +73.5% from FY2019 levels) partly to blame, readers may want to pay attention to its performance over the next few quarters, with it uncertain if the AI-related HBM demand may trigger the improvement in the company’s balance sheet.
Two, MU’s ongoing capacity expansions in Idaho and New York are likely to trigger intermediate term Free Cash Flow headwinds, since they are only in permit submission process with any top/bottom-line contribution only occurring “in the latter half of the decade.”
Therefore, investors may want to temper their near-term dividend expectations, since its payout growth per share is likely to be stagnant over the next few years of heavy capex spending.
So, Is MU Stock A Buy, Sell, or Hold?
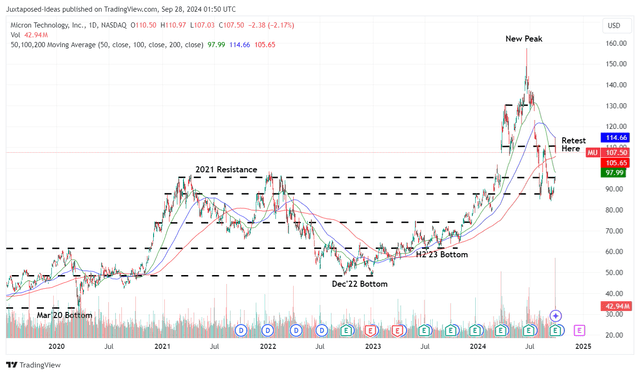
MU 5Y Stock Price
For now, MU has charted the golden cross between the 50-day moving average and the 200-day moving average – with it implying a bullish breakout pattern after the painful pullback in July/August 2024.
Based on the management’s FQ1’25 annualized adj EPS guidance of $6.96 at the midpoint and the FWD P/E non-GAAP valuations of 12.34x (not too far from its 10Y P/E mean of 12.29x), it appears that the stock has (yet again) ran away from our fair value estimates of $85.90.
Even so, based on the consensus raised FY2026 adj EPS estimates from $11.83 to $12.67, we are looking at an excellent upside potential of +45.3% to our long-term price target of $156.30, despite the recent recovery.
While MU’s dividends have been flat over the past 2.5 years, the annualized payout of $0.46 per share also allows long-term shareholders to enjoy a regular income and/or the chance to DRIP/accumulate additional shares on a quarterly basis.
As a result of the attractive risk/reward ratio after five consecutive Hold ratings, we are cautiously upgrading the MU stock as a Buy.
It goes without saying that the market is currently rather exuberant after MU’s promising FQ1’25 guidance, as observed in the stock’s recent break-out from its 50/200 day moving averages.
The same has been observed in the elevated CBOE Volatility Index and McClellan Volume Summation Index, with a near-term market wide correction very likely with it potentially moderating part of MU’s recent gains.
As a result of the potential volatility, we urge interested investors to observe the stock’s movement for a little longer before adding, preferably upon a moderate retracement to its previous trading ranges of between $95s and $100s for an improved margin of safety – with those levels also nearer to our fair value estimates.
Analyst’s Disclosure: I/we have no stock, option or similar derivative position in any of the companies mentioned, and no plans to initiate any such positions within the next 72 hours. I wrote this article myself, and it expresses my own opinions. I am not receiving compensation for it (other than from Seeking Alpha). I have no business relationship with any company whose stock is mentioned in this article.
The analysis is provided exclusively for informational purposes and should not be considered professional investment advice. Before investing, please conduct personal in-depth research and utmost due diligence, as there are many risks associated with the trade, including capital loss.
Seeking Alpha’s Disclosure: Past performance is no guarantee of future results. No recommendation or advice is being given as to whether any investment is suitable for a particular investor. Any views or opinions expressed above may not reflect those of Seeking Alpha as a whole. Seeking Alpha is not a licensed securities dealer, broker or US investment adviser or investment bank. Our analysts are third party authors that include both professional investors and individual investors who may not be licensed or certified by any institute or regulatory body.


