
Summary:
- Micron’s revenue could be impacted by Chinese regulations, but the company may benefit from market pricing recovery and price increases.
- Micron has a 10% share in the HBM memory market, trailing behind Samsung and SK Hynix.
- Micron’s competitiveness in HBM3e could position it well to capture market share and increase its share from 5% in 2023 to 23% in 2026.
HECTOR RETAMAL/AFP via Getty Images
In our previous assessment of Micron (NASDAQ:MU), we anticipated that new Chinese regulations could impact Micron’s revenue by 5.6% to 25%, with our base case aligning with Micron’s guidance at an 11.3% revenue reduction. Despite potential benefits for competitors like Samsung and SK Hynix, Chinese chipmakers, particularly YMTC in NAND, could exploit the ban, against Micron. Though pricing may experience minimal impact, we anticipated market pricing recovery with Micron already implementing price increases.
In this follow-up analysis, we focused on Micron’s potential growth through High Bandwidth Memory (‘HBM’) following its recent earnings briefing, which highlighted the opportunities of HBM in the context of AI. Firstly, we examined Micron’s competitive position in the HBM DRAM chip market. Additionally, we delved into how AI drives the demand for memory chips in data centers, particularly HBM DRAM. Lastly, we assessed the company’s capital expenditure plans and updated our supply growth projection to determine its ability to capitalize on demand growth, while also analyzing market pricing trends.
Micron Competitive Positioning in HBM
|
Micron FY2023 |
Actual |
Our Previous Forecast |
|
DRAM Revenue ($ bln) |
11.0 |
21.03 |
|
DRAM Revenue Growth |
-61.3% |
-6.10% |
|
ASP % |
-49% |
39.9% |
|
Unit Shipments % |
13% |
0.80% |
|
NAND Revenue ($ bln) |
4.2 |
8.38 |
|
NAND Revenue Growth |
-46.4% |
7.30% |
|
ASP % |
-38% |
65.90% |
|
Unit Shipments % |
15% |
8.10% |
|
Total Revenue ($ bln) |
15.54 |
29.82 |
|
Growth |
-49.48% |
-3.05% |
Source: Company Data, Khaveen Investments
In FY2023, Micron’s full-year results showed a decline of 49.5%, which is well below our previous forecasts of a decline of 3%. This is as both its DRAM and NAND revenues fell by 61% and 46%, primarily due to ASP declines of 49% and 38%. In comparison, we had projected the full-year ASP growth for DRAM and NAND to be positive as we expected the demand-supply situation to stabilize as the top chipmakers cut capex. However, actual unit shipment growth was positive compared to our forecast for DRAM and NAND.
Furthermore, we examine Micron’s competitive positioning within HBM memory, a type of DRAM memory with low power usage and wide communication lanes, to determine whether it could capitalize on the growth opportunity.
TrendForce, Khaveen Investments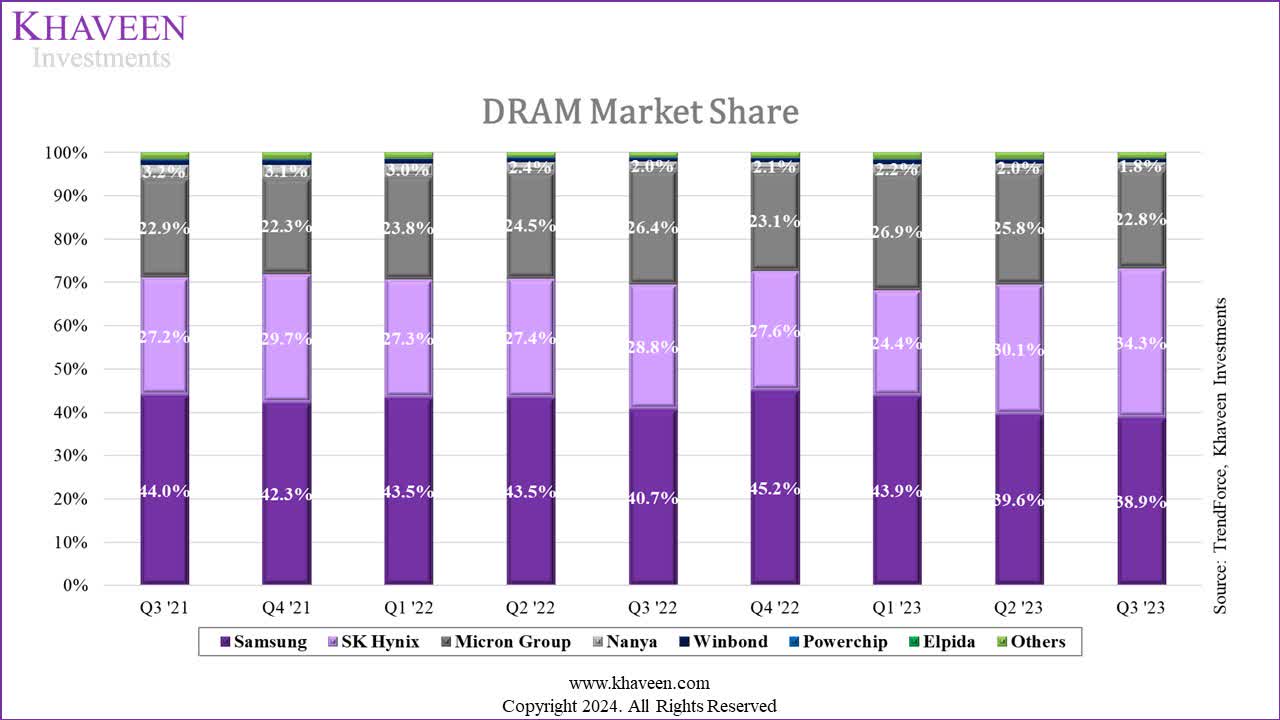
In the overall DRAM market, Micron has a 25% share, trailing behind market leaders Samsung (OTCPK:SSNLF) and SK Hynix.
TrendForce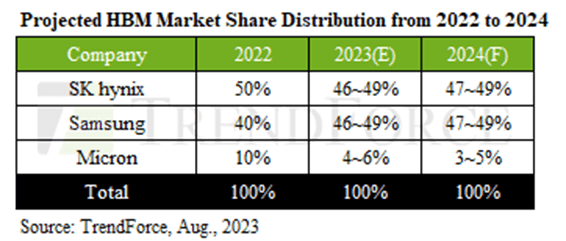
However, according to TrendForce, Micron’s share in the HBM market is only 10% in 2022. Whereas SK Hynix led the market followed by Samsung. SK Hynix is the primary producer of HBM3 and had a first-mover advantage as the first company to supply NVIDIA (NVDA) initially with its H100 chips. However, Micron followed by launching its HBM3 memory in July 2023. Furthermore, the company also recently launched its next-gen HBM3E memory with improved memory performance.
TrendForce, Khaveen Investments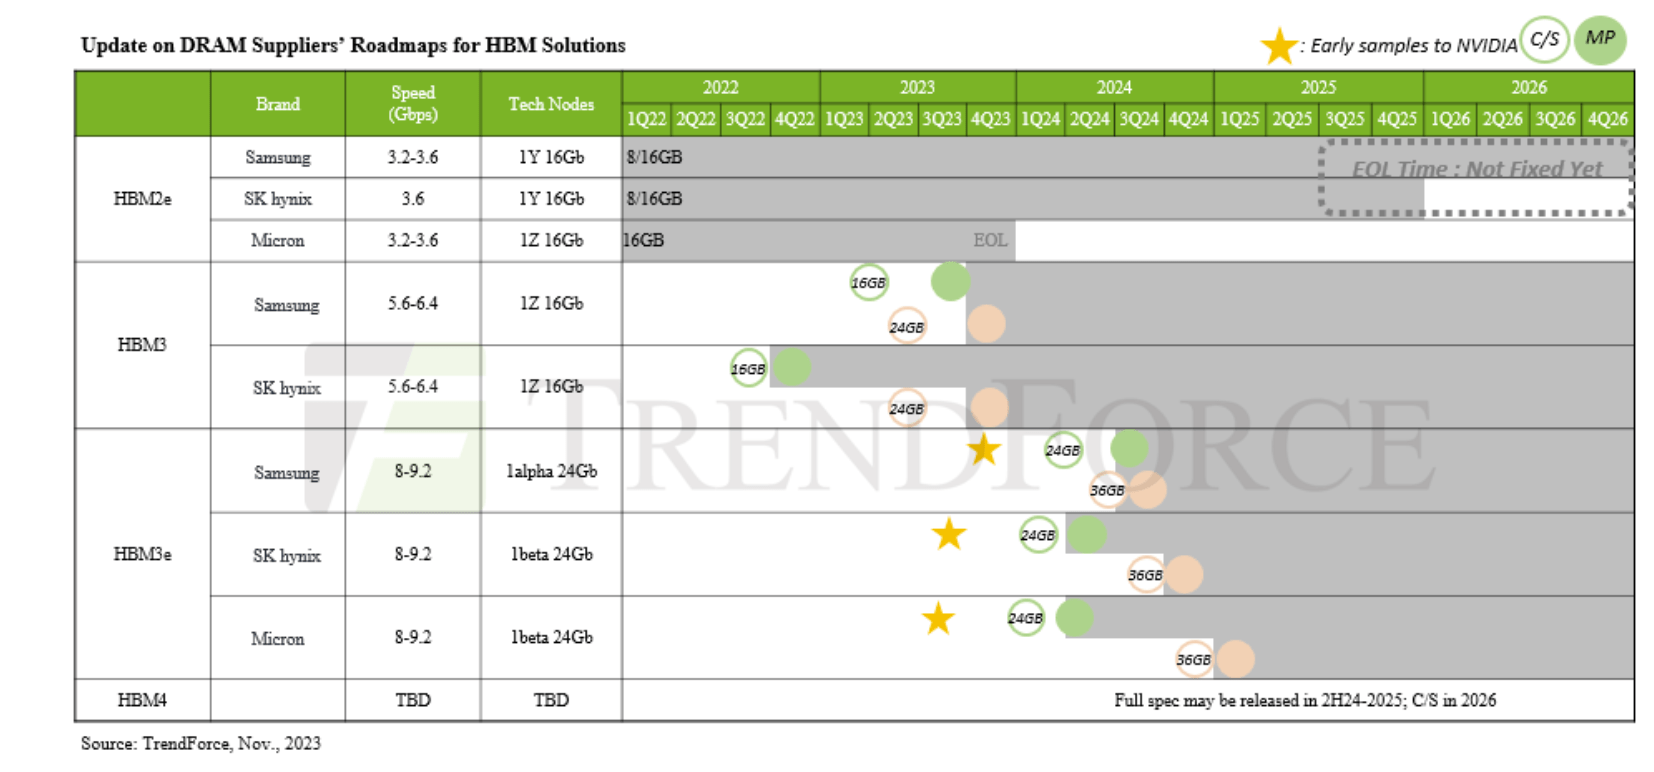
The timeline above shows different launches of HBM3 and HBM3e of Samsung, SK Hynix, and Micron. In Q1 2024, Micron is expected to launch its new HBM3e memory. Additionally, SK Hynix and Samsung are expected to release their HBM3e memory shortly after, with Samsung unveiling the first 36GB HBM3e in 4Q24. Comparing the timeline between each company’s launch of HBM3 and HBM3e, SK Hynix takes more than a year to release HBM3e, Samsung takes 1 year and Micron only about 2 quarters, highlighting Micron’s focus on HBM3e.
We compared the performance metrics of the latest HBM3e to determine whether Micron or its competitors have an advantage.
|
Generation |
Data Rate (Gb/s) |
Bandwidth per Device (GB/s) |
Max. DRAM Capacity (‘GB’) |
|
HBM |
1.0 |
128 |
16 |
|
HBM2 |
2.0 |
256 |
16 |
|
HBM2E |
3.6 |
461 |
24 |
|
HBM3 |
6.4 |
819 |
32 |
|
HBM3E (Micron) |
>9.2 |
>1200 |
36 |
|
HBM3E (Samsung) |
9.8 |
1225 |
36 |
|
HBM3E (SK Hynix) |
8 |
1150 |
36 |
Source: Rambus, AnandTech, Micron, Khaveen Investments
According to the information provided in the table, HBM3 exhibits a performance improvement of 2 times over HBM2e, achieving a data rate of up to 6.4Gb/s. Data Rate is described as “the speed at which data is transferred from one device to another or between a peripheral device and the computer”. Higher data rates play a critical role in enhancing AI applications, particularly in data-intensive tasks like inferencing. Moreover, a higher data rate ensures quick transfer of large volumes of data, reducing latency and optimizing overall system performance. However, with the anticipated introduction of HBM3e in H1 2024, the performance is better than HBM3, as HBM3e boasts a 1.5x higher data rate and bandwidth per device. Samsung’s HBM3e specs outperform Micron and SK Hynix overall with higher data rate and bandwidth per device, but Micron edges out SK Hynix. Therefore, in the near term, we expect Micron’s competitiveness in HBM3e to position it well to capture market share from current leader SK Hynix.
Overall, we projected Samsung, SK Hynix, and Micron’s HBM market share through 2026 based on their DRAM market share in Q3 2023 as we expect Micron to capture market share with its competitiveness in HBM3e and prorated its share between 2023 and 2026 to forecast their 2024 and 2025 market share. Based on this, we expect Micron’s share to increase from 5% in 2023 to 23% in 2026.
|
HBM Market Share Forecast |
2022 |
2023 |
2024F |
2025F |
2026F |
|
SK Hynix |
50% |
48% |
43% |
39% |
34% |
|
Samsung |
40% |
48% |
45% |
42% |
39% |
|
Micron |
10% |
5% |
11% |
17% |
23% |
Source: Company Data, Khaveen Investments
Data Center Boosted by HBM for AI Applications
Sever GPUs from Nvidia, AMD (AMD) and Intel (INTC) which we previously covered for AI applications, feature HBM memory. According to DigiTimes, Micron has secured a partnership with Nvidia, for the supply of HBM chips valued at $770 mln. As covered previously, Nvidia is the market leader in server GPU with an estimated 95% market share. Based on its latest earnings briefing, Micron’s management highlighted the “aggressive roadmaps for new GPU and AI accelerator ASIC product introductions”, leading to demand for better HBM chips. We compiled Nvidia and AMD’s server AI GPUs below with their memory bandwidth to analyze the growth in memory capacity requirements.
|
Nvidia |
A100 |
H100 |
H200 |
|
Memory Bandwidth (GB) |
|||
|
Growth % |
0% |
76% |
|
|
Type |
HBM2e |
HBM3e |
HBM3e |
|
Year |
2020 |
2023 |
2024 |
|
AMD |
MI200 |
MI250 |
MI300x |
|
Memory Bandwidth (GB) |
128 |
128 |
192 |
|
Growth % |
0% |
50% |
|
|
Type |
HBM2e |
HBM2e |
HBM3 |
|
Year |
Dec-21 |
Nov-21 |
Dec-23 |
Source: Company Data, Khaveen Investments
Furthermore, based on the table above, the next-generation server GPUs from Nvidia and AMD have higher memory bandwidth, using next-gen HBM memory chips which we believe benefits demand growth for Micron.
TrendForce, SIA, Khaveen Investments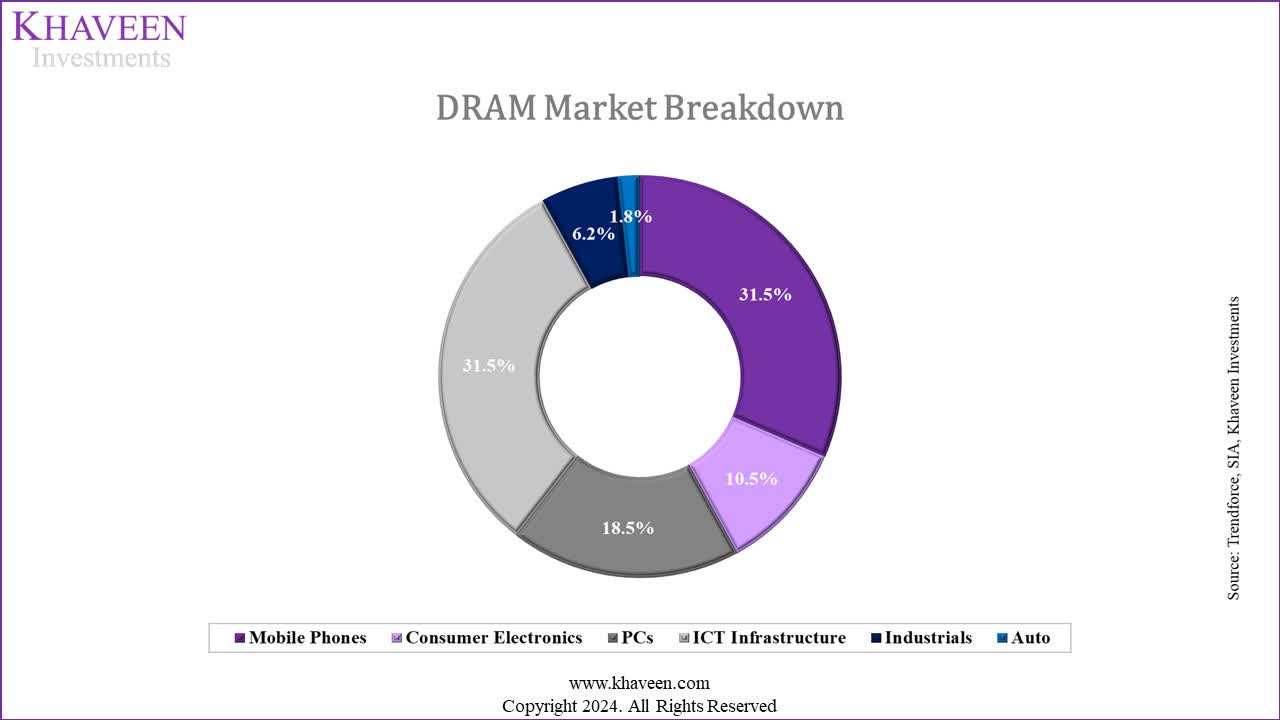
|
DRAM |
2023E |
2024F |
2025F |
2026F |
|
Mobile Phones |
3.0% |
11.3% |
11.3% |
11.3% |
|
Consumer Electronics |
4.5% |
4.5% |
4.5% |
4.5% |
|
PCs |
-3.8% |
32.5% |
19.9% |
13.9% |
|
ICT Infrastructure |
8% |
8% |
8% |
8% |
|
ICT Infrastructure (With HBM) |
8% |
14% |
14% |
14% |
|
Industrials |
1.70% |
1.70% |
1.70% |
1.70% |
|
Auto |
32% |
32% |
32% |
32% |
|
Total DRAM Demand Growth % |
4.4% |
12.8% |
11.3% |
10.5% |
|
Total DRAM Demand Growth % (With HBM) |
20.0% |
15.0% |
13.4% |
12.6% |
|
HBM Boost to DRAM Market Demand |
2.2% |
2.1% |
2.1% |
|
|
Micron HBM Market Share Increase |
5.9% |
5.9% |
5.9% |
|
|
Micron DRAM Demand Growth |
20.0% |
17.5% |
16.0% |
15.3% |
Source: Company Data, Khaveen Investments
Therefore, we projected the growth in DRAM market demand with HBM. Based on our updated breakdown, we believe HBM to benefit from demand growth for the ICT Infrastructure segment as it is used in servers. We derived a share of HBM of total DRAM (4%) based on the HBM market size of $2 bln of the total DRAM market size in 2023. We calculated a weighted average growth for ICT infrastructure (8%) and HBM (63%) to derive a new ICT infrastructure growth of 14%. In total, we calculated an increase in total DRAM demand of 2.1% due to HBM. Additionally, we factored in our Micron share in HBM increase by multiplying with the demand growth.
Furthermore, in terms of supply, the company highlighted that it sees market recovery underway but “will continue to exercise supply and CapEx discipline”. The company also highlighted its plans to increase capex spending slightly to between $7.5 bln to $8 bln, higher compared to the previous year at $7 bln, but the increase is mainly to focus on production for HBM memory. More importantly, Micron guided the company’s and the market’s DRAM and NAND supply growth for FY2024 to continue to be lower than demand growth, indicating the potential for continued market pricing recovery throughout the year.
|
Demand |
2024F |
2025F |
2026F |
|
DRAM Growth % |
15.0% |
13.4% |
12.6% |
|
NAND Growth % |
25.7% |
27.6% |
22.1% |
|
Supply |
2024F |
2025F |
2026F |
|
DRAM Growth % |
1.0% |
5.3% |
6.0% |
|
NAND Growth % |
7.4% |
19.1% |
18.6% |
|
Market Growth Limiting Factor |
2024F |
2025F |
2026F |
|
DRAM (Supply) |
1.0% |
5.3% |
6.0% |
|
NAND (Supply) |
7.4% |
19.1% |
18.6% |
Source: Company Data, Khaveen Investments
We updated our total supply projections from our previous analysis based on the top 3 companies’ latest capex guidance and projected the difference between demand and supply growth for 2024 through 2026. As seen above, we continue to see the market supply growth for DRAM and NAND to be lower than demand growth through 2026, making it the limiting factor for our shipment growth projections for Micron.
Market Pricing Recovery
For this point, we examined the pricing trend of DRAM and NAND and analyzed how it could affect Micron’s growth outlook.
JCMIT, PCPartPicker, Khaveen Investments JCMIT, PCPartPicker, Khaveen Investments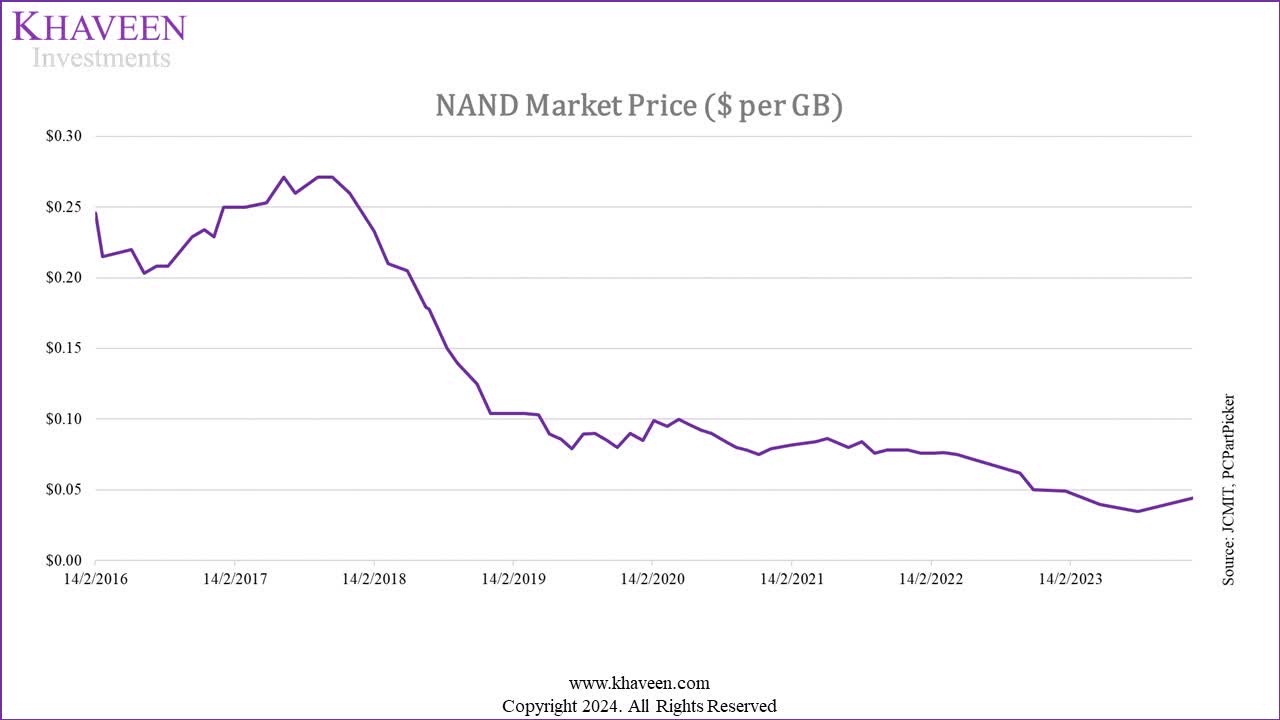
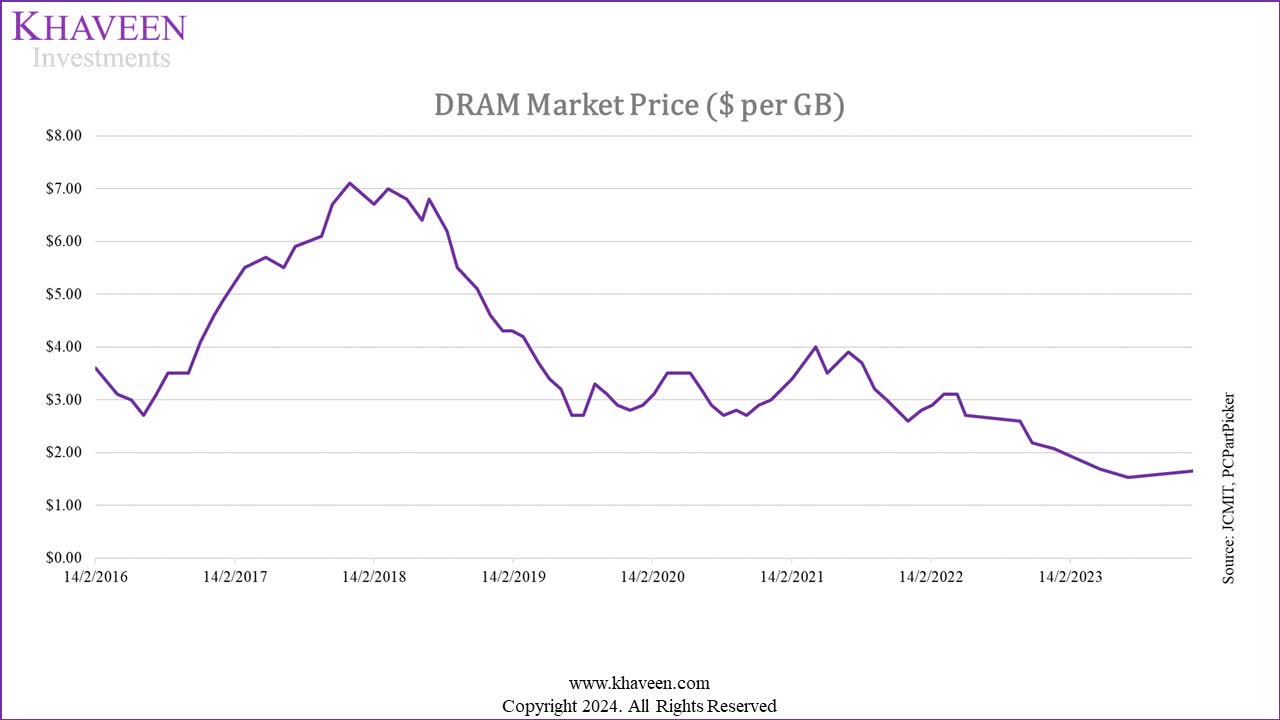
Based on the charts, both NAND and DRAM pricing have started to stabilize from Q3 2023 and have rebounded in Q4, with NAND and DRAM pricing up by 28% and 8% in Q4 2024. However, the increase was unable to offset the declines in the first half of the year, bringing the full-year pricing growth to -12% for NAND and -24% for DRAM. Therefore, compared to our previous analysis where we had higher pricing growth for the full year in 2023, both DRAM and NAND pricing only recovered later the year in Q4, leading to the difference in our forecast. One of the factors for the late recovery in the market pricing is due to the slow end market recovery which only recovered with positive growth from Q3 2023 such as in smartphones and PCs which grew by 11% and 8% QoQ in Q3 respectively.
|
ASP Growth Forecast |
2023 (Our Previous Forecast) |
2023 (Actual) |
2024 (Our Previous Forecast) |
2024 (Current Forecast) |
|
DRAM |
39.9% |
-24% |
3.0% |
93.5% |
|
NAND |
65.9% |
-12% |
1.9% |
18.3% |
Source: Company Data, Khaveen Investments
Based on our updated analysis, we derived a new forecast pricing growth for DRAM and NAND based on the long-term pricing trend and factor that with our difference in market demand and supply growth as calculated in the previous point. Overall, we expect the market pricing recovery in DRAM to be strong at 93.5% and 18.3% in NAND, higher compared to our previous forecast for 2024. Therefore, our updated price forecasts reflect an adjustment in our expectations for rising prices pushed back to 2024 as we previously expected it earlier in 2023. Another factor to support the strong pricing growth for DRAM is that HBM is at least 5x more expensive compared to normal DRAM chips.
In total, we projected Micron’s revenue growth in the table below to increase significantly by 59% in FY2024 followed by more normalized growth beyond 2024, based on our DRAM and NAND ASP and shipment growth projections. This is driven primarily by strong pricing growth of 93.5% for DRAM and 18.3% for NAND despite, as we expect Micron to benefit from the market pricing recovery.
|
Micron Revenue Projection ($ bln) |
2024F |
2025F |
2026F |
|
DRAM |
19.63 |
23.05 |
23.84 |
|
Growth % |
78.1% |
17.4% |
3.5% |
|
NAND |
4.90 |
4.91 |
4.77 |
|
Growth % |
16.6% |
0.2% |
-2.7% |
|
Others |
0.20 |
0.20 |
0.20 |
|
Growth % |
-36.5% |
-43.8% |
0.0% |
|
Total Revenue |
24.73 |
28.16 |
28.82 |
|
Total Growth % |
59.12% |
13.86% |
2.35% |
Source: Company Data, Khaveen Investments
Verdict
Khaveen Investments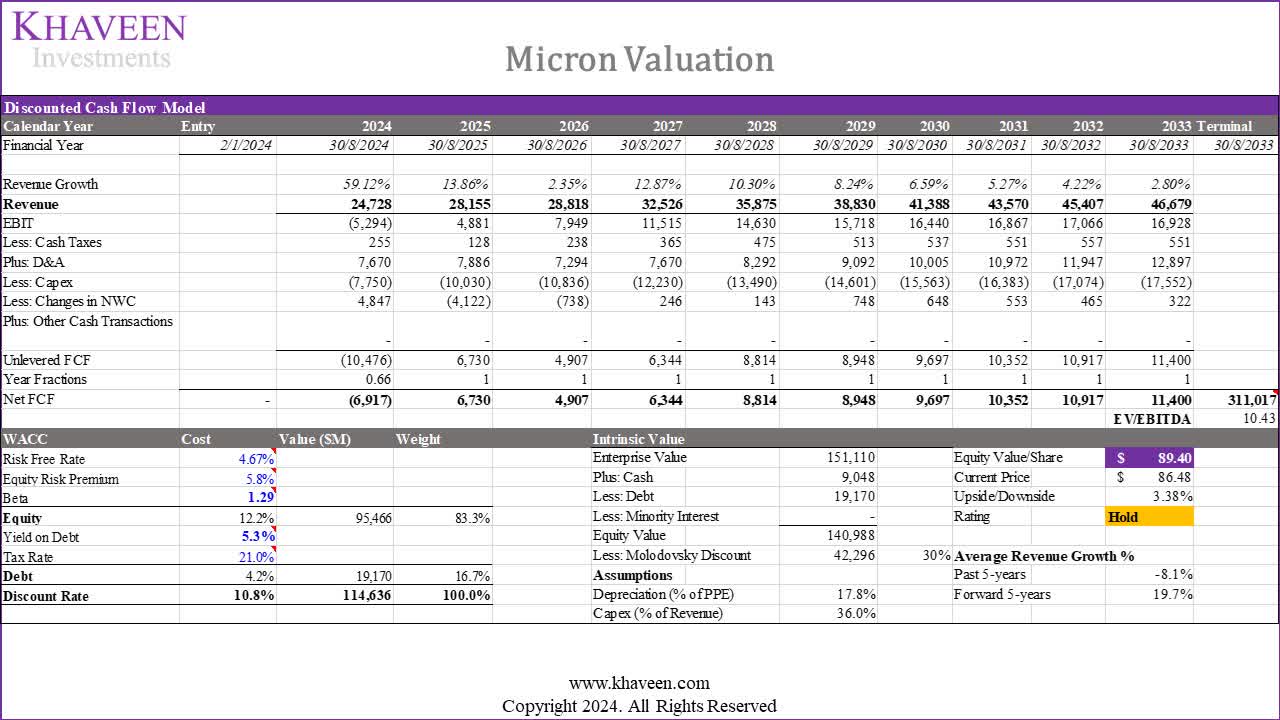
Overall, in the near term, we anticipate Micron’s strong position in HBM3e to drive market share gains, potentially challenging the current leader, SK Hynix. Our projections for Samsung, SK Hynix, and Micron’s HBM market share through 2026 are based on their DRAM market share in Q3 2023. We project Micron’s share to rise from 5% in 2023 to 23% in 2026, attributing this growth to its competitiveness in HBM3e.
Our updated supply projections, incorporating the latest capex guidance from the top 3 companies, allowed us to calculate the difference between demand and supply growth for 2024 through 2026. Taking into account the long-term pricing trend, we forecast a robust pricing recovery in DRAM at 98.9% and in NAND at 18.3%. This anticipated pricing growth is further bolstered by market supply balancing efforts by top companies as well as HBM’s premium compared to standard DRAM chips. In total, we see Micron’s revenue recovering strongly in 2024 with a forecast growth of 59%. Based on our updated valuation, we obtained a price target of $90.71, a limited upside of 4.9%, despite an increase compared to our previous analysis of $77.16 due to a higher 5-year forward average growth of 20% vs 1% previously, thus we rate the company as a Hold as its stock price has risen by 22% since our last coverage. Though, our price target is considered conservative considering the 30% Molodovsky discount we have added.
Analyst’s Disclosure: I/we have a beneficial long position in the shares of MU either through stock ownership, options, or other derivatives. I wrote this article myself, and it expresses my own opinions. I am not receiving compensation for it (other than from Seeking Alpha). I have no business relationship with any company whose stock is mentioned in this article.
No information in this publication is intended as investment, tax, accounting, or legal advice, or as an offer/solicitation to sell or buy. Material provided in this publication is for educational purposes only and was prepared from sources and data believed to be reliable, but we do not guarantee its accuracy or completeness.
Seeking Alpha’s Disclosure: Past performance is no guarantee of future results. No recommendation or advice is being given as to whether any investment is suitable for a particular investor. Any views or opinions expressed above may not reflect those of Seeking Alpha as a whole. Seeking Alpha is not a licensed securities dealer, broker or US investment adviser or investment bank. Our analysts are third party authors that include both professional investors and individual investors who may not be licensed or certified by any institute or regulatory body.