Summary:
- Fiscal Q1 earnings were abysmal, and sentiment couldn’t be worse. History shows this is the time to buy.
- Although short-term earnings are volatile, the pull-back in memory supply may slingshot memory prices in 2025 as the semiconductor market rebounds.
- Micron is approaching tangible book value, but it may never reach this level. Buy some now and add to the position if these bargain basement prices are reached.
ferrantraite/E+ via Getty Images
One sub-sector that may be ripe for the picking is the semiconductor space which is going through its own recession, and that leads us to a discussion of Micron (NASDAQ:MU). Micron makes advanced memory modules for the world, and they are a strong market leader with an enviable balance sheet. These are the memory chips in all the tech in the market: smartphones, edge devices, computers, data centers, cars, 5G networks, AI and on and on. All these macro trends will require more compute and more memory and each one of them could take up an entire article, so for now, let’s put a pin in all the widget prognostication and just unpack the numbers for the company.
Micron’s Earning History
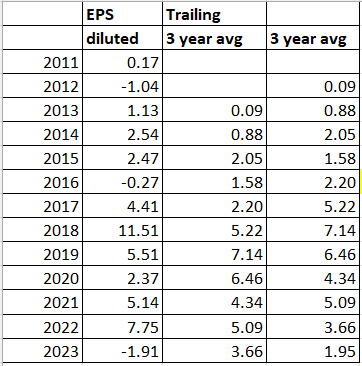
Here is 10 years of diluted EPS (earnings per share) data for Micron pulled from their annual reports:
Micron EPS Data (Micron Annual Reports)
You’ll notice that their earnings are highly volatile, even chaotic. The earnings are so unpredictable that Micron hasn’t provided full 2023 guidance, except to vaguely say their fiscal Q1 and Q2 will be negative with a recovery in Q3 and Q4. Fiscal Q1 came in at negative $0.18 per share and Q2 will come in at negative $0.62 +/- 0.10. Given the uncertainty, we’ve plopped the estimated average earnings per share in their fiscal 2023 as a place holder until more information arrives.
Micron Analyst EPS estimates (Seeking Alpha)
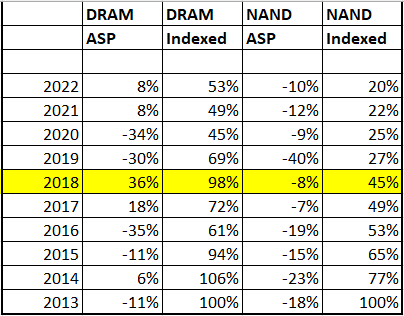
Some investors will shy away from companies that don’t produce steady and predictable returns, but let’s take a moment and digest the data. Memory is a commodity and like all commodities, it goes through a boom-and-bust cycle. When demand and prices are robust, semiconductor memory companies like Micron, SK Hynix and Samsung (OTCPK:SSNNF)(OTCPK:SSNLF) who collectively own 95% of the DRAM market-share tend to overbuild supply, and this leads to times like now, where we have an oversupply of memory chips on the market and the average selling prices (ASPs) for their products plummet, killing the memory net income for all 3 companies. In addition, the average selling prices (ASPs) for their products are on a long-term decline as shown by the follow chart.
Micron’s Average Selling Price by year (Micron Annual Reports)
On an ASP basis, DRAM is selling for half of what it sold for in 2013 and NAND is fetching only 20% relative to 2013. Note that 2018 was a complete outlier. The 2018 ASP for DRAM (which makes up 70% of their sales) was nearly identical to the ASP in 2013 leading to a peak in net income that has yet to be repeated.
If we track their net investments in equipment, plants and acquisitions, subtracting things like divestitures and government subsidies, we find that they have net investments of $65 billion dollars over the previous 10 years, of which they have depreciated and amortized $40 billion. Not only are their ASPs on a long-term downtrend, but the value of their equipment, plants and acquisitions are on a fast moving treadmill. They need to produce large volumes of memory to feed a growing market and charge a high enough margin for leading edge chips to offset the natural declines.
If we take a 3-year average – 2012 through 2014 and compare it with 2021 through 2023e, we see that their net income grew from $1067 billion to about $5540 billion – a 5-fold increase and 6.9% yield on their entire $65 billion dollar net investment. In addition, the entirety of that $65 billion was self-funded with a pristine balance sheet that is now showing negative debt. If we take their cash on hand, short-term and long-term marketable securities and subtract their current and long-term debt, we find they have a surplus cash position of $1.8B which is rare. With the Fed aiming to quash inflation by raising rates, companies with modest levels of debt are preferred. Even with the poor showing in fiscal Q1 2023, and ASPs and bit shipments that have plunged QoQ by over 20%, their balance sheet is rock solid and should weather the downtown.
Valuation
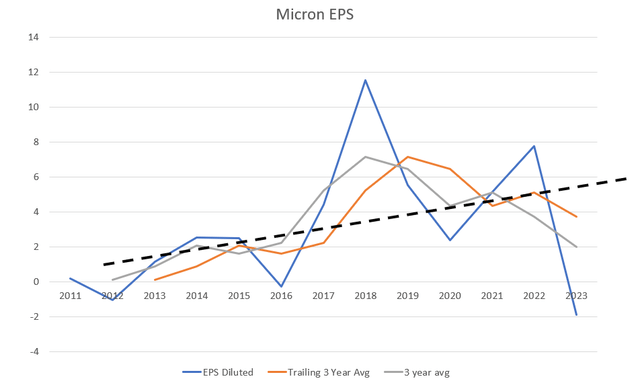
How do we value the stock? When the data is volatile, one of the best ways is to play around with the data until the overall pattern is clear. Here’s what that looks like.
Micron’s Yearly EPS (Micron Annual Reports)
The averaged EPS data shows a gradual rise in earnings per share. The diluted EPS represented by the blue line shows the outperformance in 2018 (an outlier) and projected 2023 earnings, a mirror-image outlier to the downside. The gray line is a trailing 3-year average. The plain 3-year average takes the previous year, the current year and the next year’s EPS and blends that into an average. Finally, the bold dashed line is an eye-ball average of all lines. You can see that the 2018 EPS data skews the 3-year averages to the high side and the 2023 projections skew it in the opposite direction.
Long Term Outlook
I believe the analysts have the duration of the earnings trough correct. When we look at the quarterly data for the last major downturn in 2016 where earnings went negative, it took several quarters to right the ship, but note how prices boomeranged to all-time EPS highs in 2018, following the recovery. If the pattern repeats, then 2023 is a write-off, 2024 is a normal recovery period, followed by a robust 2025. Perhaps the analyst’s long-term earnings expectations are a bit understated in that regard. The boom/bust scenario for the memory space is not dissimilar to other commodities like oil and gas which got washed out in 2020, recovered in 2021 and excelled in 2022.
Micron’s Quarterly Earnings History (Micron 10-Q SEC Filings)
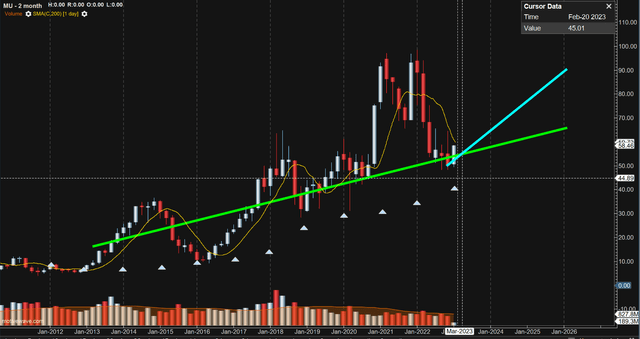
Let’s take the dashed black line in the previous graph, multiple that by 10 and plot it against price (a P/E ratio of 10 or 10%).
Micron 10 year Price chart (Author/MotiveWave )
This is a long-term chart of Micron – each candle represents two months of data with a 200-day moving average (thin yellow line). The value zone is at or below the green line; currently anything below roughly $54.25 is rated a buy. The green line is moving up at a rate of 13% per year. That return plus the modest 1% dividend handily beats the returns of the S&P500 (See SPY: The Long-Term Case for this Market).
Tangible Book Value
The white triangles mark the tangible book value in Micron for each year going back 10 years. Tangible book value (TBV) is calculated by taking assets minus liabilities minus intangible assets like goodwill and deferred tax assets. As such, TBV represents a washed-out, bargain basement price for Micron. Micron is a capital-intensive business and TVB reflects support from value investors climbing into Micron at the bottom. Note, price barely touched the tangible book value in 2016, the last time earnings went negative. Also, note that pricing recovered well in advance of the earnings recovery, suggesting that the time to buy is now. If pricing falls lower, simply dollar cost average down to a low of $42 per share. Be greedy when others are fearful.
There are a variety of ways to play this. There is nothing wrong with being a buy and hold investor in Micron. I suspect you will outperform overall market returns if MU were the only stock you held, assuming you bought the stock close to its value line or waited long enough to justify buying at higher prices. Because of the volatility of earnings in the space, I recommend having a minimum 3-to-5 year horizon for long-term investors.
Short term trades (selling option puts and buying dips) are both viable. You can also buy now and sell in a couple of years if pricing retakes the highs. A conservative 3-year price target is $90 (turquoise line in price chart), but keep an open mind if the intrinsic value of Micron rises or falls. The interim time from now until that price is reached is a time to study the company and revalue it if necessary. Your price target should be periodically revisited as new information arrives. If the economy softens and the Fed charges in with zero % interest rates, a price above $100 is achievable.
For swing trades, I recommend aiming for 50% annualized returns (ex. buy at $52 and sell at $56 in 8 weeks or less) with a fallback position: should price collapse below $50, be prepared to accumulate the stock with a 3-to-5 year price recovery horizon. The lower it goes, the greater the value, but you must remain flexible. Allow your time horizon to expand and keep surplus cash on hand if things don’t go your way and you need to average down. We are roughly 4 months into an earnings downturn that on average lasts 14-17 months, but it could certainly go longer.
Conclusion
Mohnish Pabrai, the famed value investor, took a 10% bet on Micron in 2018 in the 30’s. He bought below the green value line. His price has nearly doubled even with the pull-back in pricing. He is probably betting on Micron’s long-term value and likely expects the stock to rise significantly. That value provides a floor to price. But one thing is for sure, Micron is a cyclical bet. You can see the wave pattern in every chart above and timing the entry and exit is not difficult. My only advice is to remain flexible on time horizon. Be patient if the pricing flatlines for a year or so. Conversely, there is no need to hang around when prices get stretched. Afterall, unlike Mohnish, you don’t report to shareholders.
Editor’s Note: This article discusses one or more securities that do not trade on a major U.S. exchange. Please be aware of the risks associated with these stocks.
Disclosure: I/we have a beneficial long position in the shares of MU either through stock ownership, options, or other derivatives. I wrote this article myself, and it expresses my own opinions. I am not receiving compensation for it (other than from Seeking Alpha). I have no business relationship with any company whose stock is mentioned in this article.
Additional disclosure: This article is for educational purposes only and it is not intended as investment advice. Please do your own diligence and if you are unsure whether an investment is right for you, please consult a licensed professional.
