
Summary:
- Microsoft has strong cash-based sources of intrinsic value – net cash on the balance sheet and solid future expected free cash flows.
- Valuation should be viewed as a range of potential fair value outcomes, and given the high end of our fair value range, we think Microsoft has upside potential.
- Over the next five years, we expect Microsoft to generate tremendous amounts of free cash flow, paving the way for substantial dividend growth.
- Right now, shares yield just shy of 1%, and it’s up to management to keep the momentum going behind its dividend growth.
- The one major concern regarding Microsoft’s dividend health is if it pursues another all-cash deal after Activision. That may lessen the attractiveness of its balance sheet.
NicolasMcComber
By Valuentum Analysts
Microsoft Corp. (NASDAQ:MSFT) is one of the most followed companies in the world, so how can it possibly be a good investment? That’s probably one of the most asked questions about the company these days, and the answer highlights the main tenets of investing. Investing is all about evaluating what you think the market is incorporating into the price with an estimate of what you think the company is worth, considering a margin of safety, of course. What we often like to do is compare the market price to our fair value estimate range (in addition to the point fair value estimate), often using the high end of the fair value estimate range to arrive at the company’s upside potential. For Microsoft, we think this upside potential is sizable, as we highlighted in our previous article on MSFT.
But Microsoft also has something else going for it. The market seems to love the name, as evidenced by its strengthening technicals. The stock recently broke out of its downtrend and has been a leader within the areas of big cap tech and large cap growth — two broader segments that have shown tremendous resilience during the past several years. The primary characteristics of companies operating in big cap tech and large cap growth are strong net cash positions and solid future expected free cash flows — two of the primary cash-based sources of intrinsic value within enterprise valuation, or the discounted cash-flow process. Microsoft has both a huge net cash position on the balance sheet, pending the close of its Activision (ATVI) deal, as well as very, very strong prospects for future expected free cash flows.
Microsoft has broken through its technical downtrend. (Image Source: TradingView)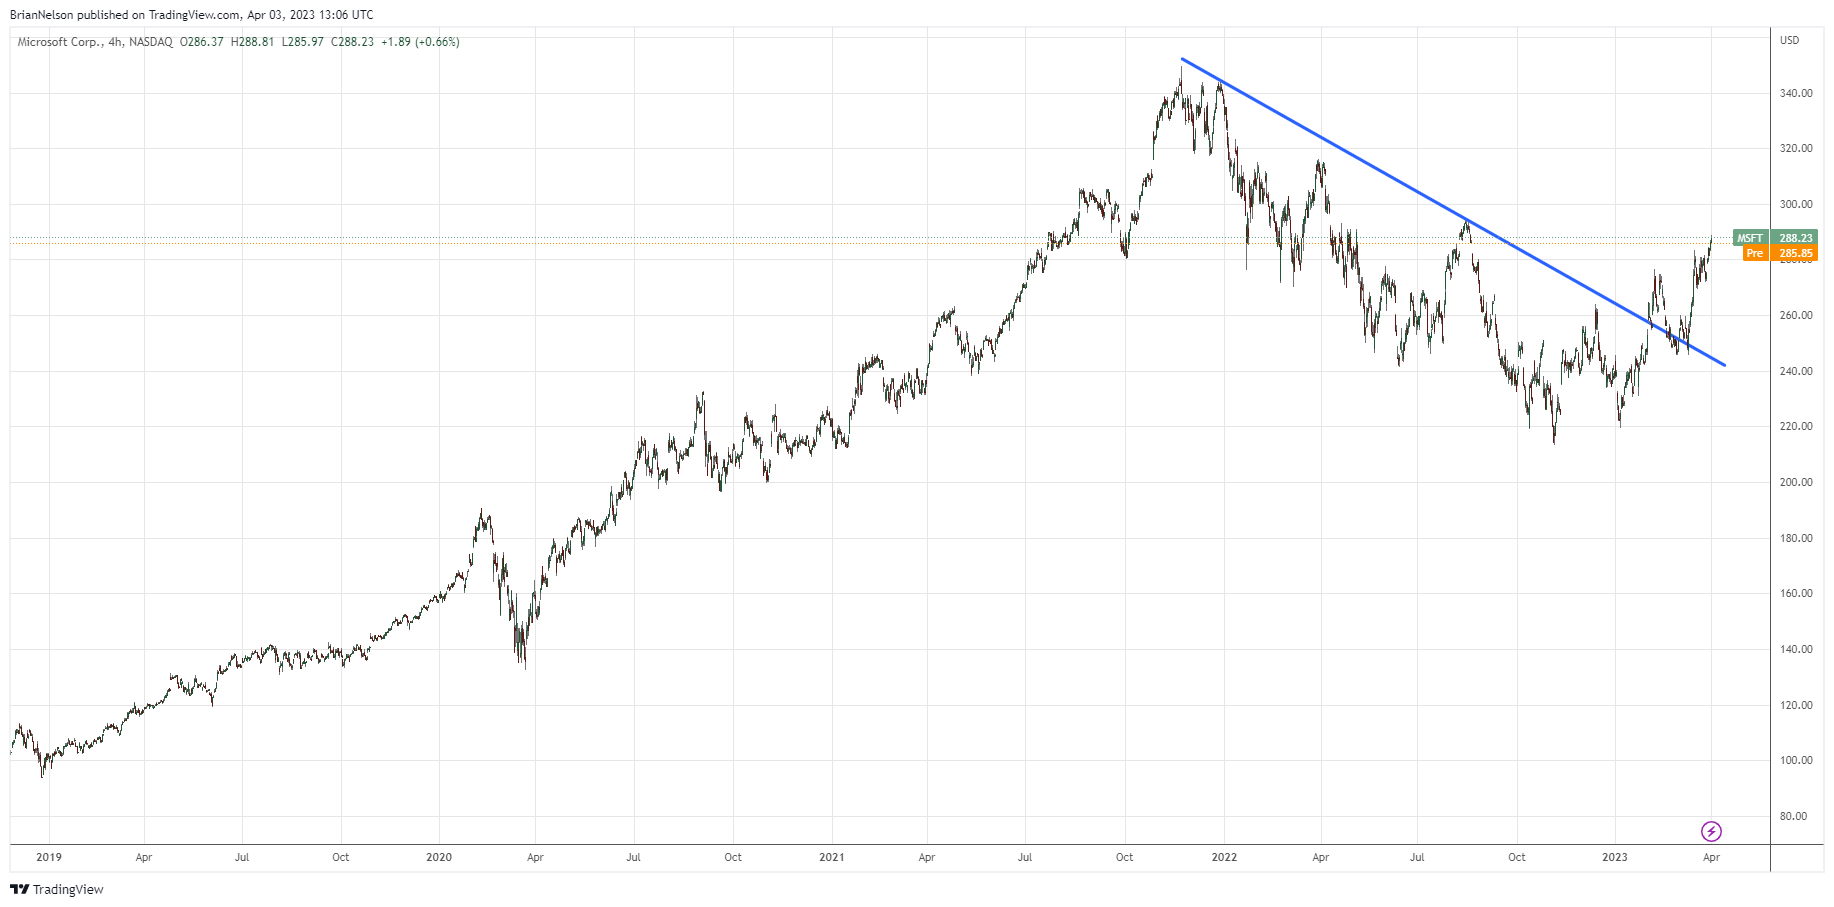
We’re big fans of companies that have valuation upside potential based on our fair value estimate range, supported by net cash on the balance sheet and future expected free cash flows, but we only like these types if companies if they are also exhibiting strong technical/momentum indicators, namely breaking out of downtrends. This is a particular style of investing that we’re quite fond of. To us, considering a strong moaty company with a solid balance sheet and tremendous free cash flow generation just makes sense, and to have the market backing the stock with strong technical/momentum indicators only adds greater conviction to the process. Said another way, we like it when both we and also the market like the same stock. One of those stocks is Microsoft!
The High End of Our Fair Value Range Stands North of $300
The high end of the fair value estimate range of Microsoft is $314. (Image Source: Valuentum)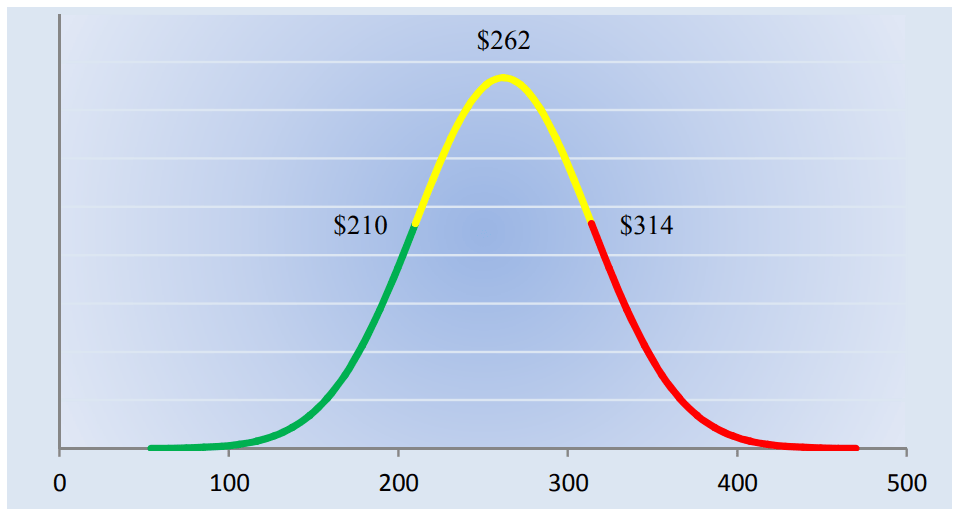
Stock prices and values are a function of future expected free cash flows. Even those that use valuation multiples understand that a valuation multiple is merely a short cut, and sometimes a hazardous one, for the discounted cash-flow model. Excluding contributions from artificial intelligence [AI], our discounted cash flow process values Microsoft at about $262 per share, but every company has a range of probable fair values that’s created by the uncertainty of key valuation drivers (like future revenue or earnings, for example).
After all, if the future were known with certainty, we wouldn’t see much volatility in the markets as stocks would trade precisely at their known fair values. This is an important consideration. The stock market is all about changes in future expectations. For example, there are certain expectations embedded in each share price, and only when those expectations change will the share price change. If everything in the future is all set, then there’s really no need for price discovery. We’d already know exactly what the company would be worth, and by extension, we’d also know its price. To be successful in investing, a lot of it comes down to assessing what expectations are in the price versus how those expectations will change in the future.
Artificial intelligence [AI] is the new kid on the block–and the big driver of potential changes in future expectations at Microsoft–and because we haven’t yet explicitly embedded contributions from OpenAI into our valuation model of Microsoft, we like to look at the fair value range of the stock. Embedded in that fair value estimate range are contributing dynamics of OpenAI that are still very difficult to model explicitly. In the image above, we show a probable range of fair values for Microsoft. We think the firm is very, very attractive below $210 per share (the green line), but quite expensive above $314 per share (the red line). The prices that fall along the yellow line, which includes our fair value estimate, represent a reasonable valuation of the firm, in our opinion.
However, there’s another way to look at the high end of the fair value estimate range. The high end of the fair value estimate range can be viewed as perhaps a new, optimistic fair value estimate considering an upside scenario in which AI initiatives pan out in a big way at Microsoft. In some respects, the high end of the fair value estimate range of Microsoft could actually be quite conservative from that perspective, as our initial impression of ChatGPT was that the technology could be world-changing. Though Alphabet (GOOG) (GOOGL) has been working for years in this area, from what we can tell, Microsoft has the clear lead in AI, and the firm has shown a tremendous ability to integrate new technologies into its platform quite successfully, with LinkedIn perhaps being the best example.
Dividend Growth Potential
The Dividend Cushion Cash Flow Bridge, shown in the image, illustrates the components of the Dividend Cushion ratio and highlights in detail the many drivers behind it. Microsoft’s Dividend Cushion Cash Flow Bridge reveals that the sum of the company’s 5-year cumulative free cash flow generation, as measured by cash flow from operations less all capital spending, plus its net cash/debt position on the balance sheet, as of the last fiscal year, is greater than the sum of the next 5 years of expected cash dividends paid. Because the Dividend Cushion ratio is forward-looking and captures the trajectory of the company’s free cash flow generation and dividend growth, it reveals whether there will be a cash surplus or a cash shortfall at the end of the 5-year period, taking into consideration the leverage on the balance sheet, a key source of risk. On a fundamental basis, we believe companies that have a strong net cash position on the balance sheet and are generating a significant amount of free cash flow are better able to pay and grow their dividend over time. Firms that are buried under a mountain of debt and do not sufficiently cover their dividend with free cash flow are more at risk of a dividend cut or a suspension of growth, all else equal, in our opinion. Generally speaking, the greater the ‘blue bar’ to the right is in the positive, the more durable a company’s dividend, and the greater the ‘blue bar’ to the right is in the negative, the less durable a company’s dividend. (Image Source: Valuentum)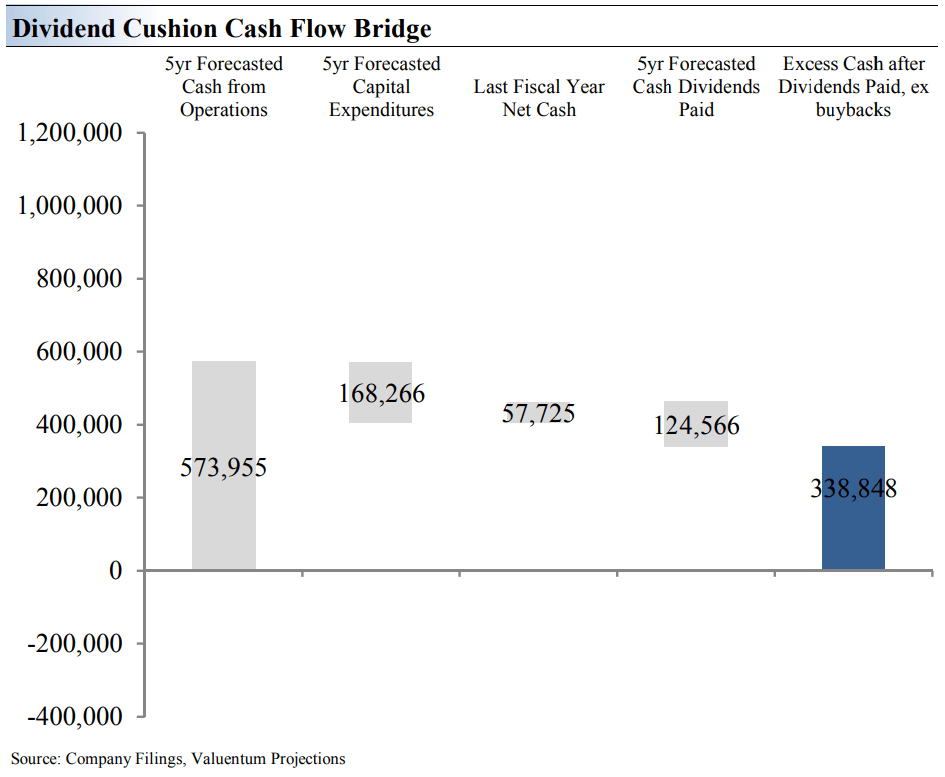
Dividend growth analysis, from our perspective, is two-fold. First, one must assess the willingness of the executive team to continue raising the dividend. An investor can look at the historical track record of dividend increases, or assess what management says about its dividend policy on a go-forward basis. This consideration is an important once because if a company’s dividend is not a priority, then the executive team may view it as just another form of discretionary capital that can eventually be used for acquisitions or to shore up the balance sheet. Microsoft has been increasing its dividend for many years now, and we expect the executive team to continue increasing it going forward.
Second, forward-looking financial analysis is very important with respect to the payout. The dividend is paid out of cash from the balance sheet, which itself is fueled by free cash flow, which is a function of cash flow from operations less capital spending. In the bridge shown in the image above, we revealed the health of Microsoft’s dividend. We expect Microsoft to generate hundreds of millions in operating cash flow in the next five years, resulting in considerable free cash flow generation. When combined with its net cash on the books, the sum simply dwarfs the total amount of cash dividends expected to be paid over that same five-year horizon. The reality is that we expect explosive growth in Microsoft’s dividend as the company has both the willingness and financial capacity to do so.
Concluding Thoughts
Frankly, it’s hard not to like Microsoft. The company has one of the most attractive dividend growth profiles, in our view, and it boasts an impressive balance sheet with a strong net cash position. The firm is the leader in [AI], in our view, as it continues to drive the transition to cloud-based software products. We’re expecting such endeavors to continue generating tremendous earnings expansion, but it’s definitely up to management to keep things moving in the right direction. Our one big concern with Microsoft is if it makes another big all-cash acquisition after Activision, but the executive team will likely have its hands full for the time being, meaning cash discipline can likely be expected. Continued strong dividend growth at Microsoft can likely be expected in the coming years, too, with shares yielding just shy of 1% at the moment.
This article and any links within are for informational and educational purposes only and should not be considered a solicitation to buy or sell any security. Valuentum is not responsible for any errors or omissions or for results obtained from the use of this article and accepts no liability for how readers may choose to utilize the content. Assumptions, opinions, and estimates are based on our judgment as of the date of the article and are subject to change without notice.
Analyst’s Disclosure: I/we have no stock, option or similar derivative position in any of the companies mentioned, and no plans to initiate any such positions within the next 72 hours. I wrote this article myself, and it expresses my own opinions. I am not receiving compensation for it (other than from Seeking Alpha). I have no business relationship with any company whose stock is mentioned in this article.
Brian Nelson owns shares in SPY, SCHG, QQQ, DIA, VOT, BITO, RSP, and IWM. Valuentum owns SPY, SCHG, QQQ, VOO, and DIA. Brian Nelson's household owns shares in HON, DIS, HAS, NKE, DIA, and RSP. Some of the other securities written about in this article may be included in Valuentum's simulated newsletter portfolios. Contact Valuentum for more information about its editorial policies. Microsoft is included in Valuentum's simulated newsletter portfolios.
Seeking Alpha’s Disclosure: Past performance is no guarantee of future results. No recommendation or advice is being given as to whether any investment is suitable for a particular investor. Any views or opinions expressed above may not reflect those of Seeking Alpha as a whole. Seeking Alpha is not a licensed securities dealer, broker or US investment adviser or investment bank. Our analysts are third party authors that include both professional investors and individual investors who may not be licensed or certified by any institute or regulatory body.