Summary:
- Rating Update: Initially rated Microsoft as “buy”, but downgraded to “hold” due to reevaluation of stock.
- Earnings Performance: Q2 2024 earnings exceeded expectations with EPS of $2.93 and revenue surpassing estimates by 1.45%.
- Valuation Analysis: Fair price estimated at $397.49, indicating a 6.6% downside from the current stock price. Future stock price for 2029 projected at $701.68, suggesting 10.8% annual returns.
FinAvenue
Thesis
In my previous article about Microsoft Corporation (MSFT), I assigned a rating of “buy” citing that my estimates and the average consensus didn’t yield “undervalued” results. Because of this, I downgrade the stock from “strong buy”. Furthermore, I estimated a fair price of $436.9.
In Q2 2024 earnings, Microsoft reported EPS of $2.93 was 5.77% higher than the expected $2.77. Then, in revenue, Microsoft beat by 1.45% the estimated revenue of $61.11B.
After re-evaluating the stock, I concluded that Microsoft is now slightly overvalued, which prompts a downgrade from “buy” to “hold”. The suggested present fair price is $397.49 which is 6.6% lower than the current stock price of $425.52. Then, the future stock price suggested for 2029 stands at $701.68, which implies 10.8% annual returns, which is in line with the average market return of 10.50%.
Seeking Alpha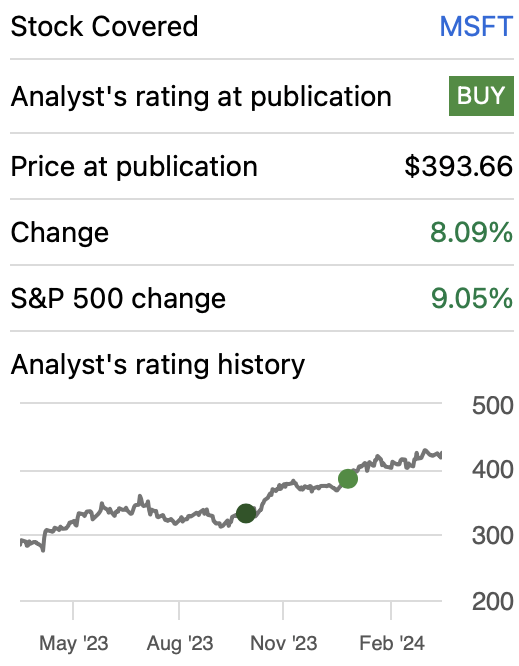
Overview
Growth Plan
In recent years, Microsoft’s strategy has been to grow its dominance in the cloud sector through Azure, which they have been doting on AI capabilities to increase efficiency for its corporate clients. Microsoft has also been pursuing partnerships and M&As, such as the acquisition of Activision-Blizard and the $20B investment in OpenAI.
How does Microsoft Compare Against Peers?
Since Microsoft has too many operations, I will focus on the ones bringing in the most revenue. These are Intelligent Cloud, Office Products and Licenses, and the Windows Operating system.
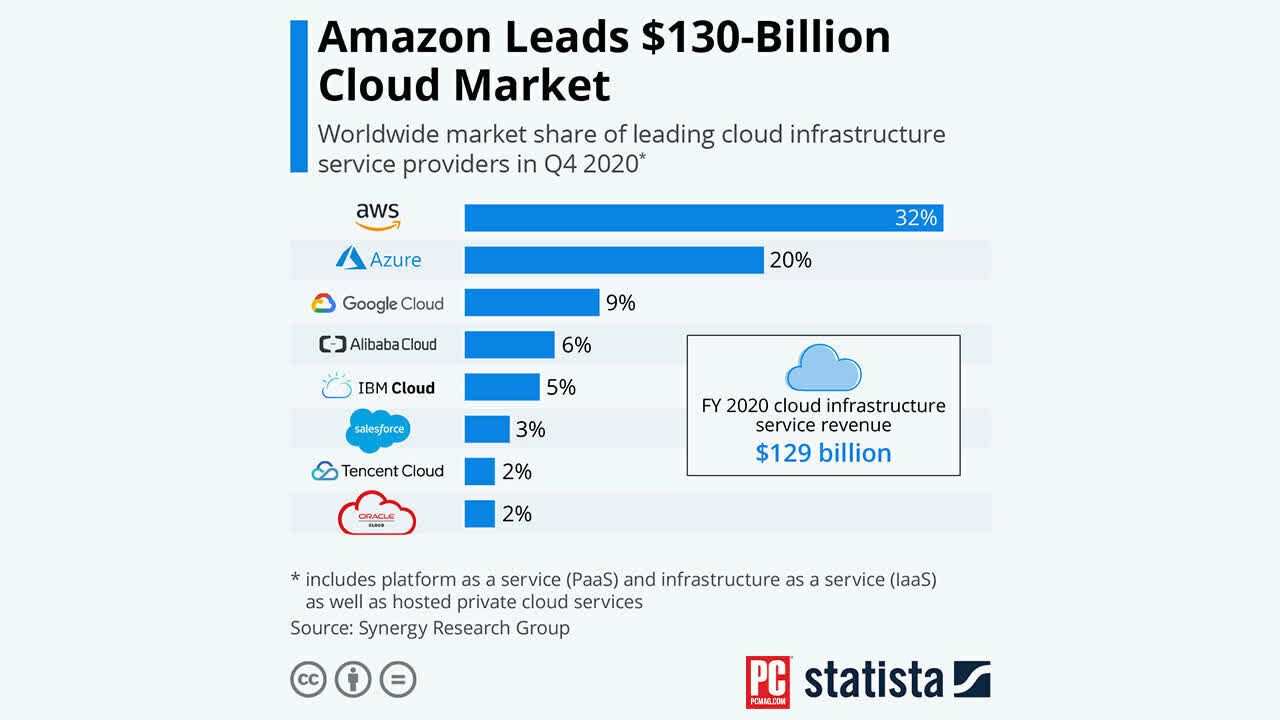
In the PaaS and IaaS cloud markets, Microsoft holds a market share of 24%, which is second to Amazon.com, Inc. (AMZN) which holds the largest market share in the market at 31%. Since Q4 2020, we can observe that Microsoft’s market share increased from the then 20% to its actual market share of 24%.
Statista Statista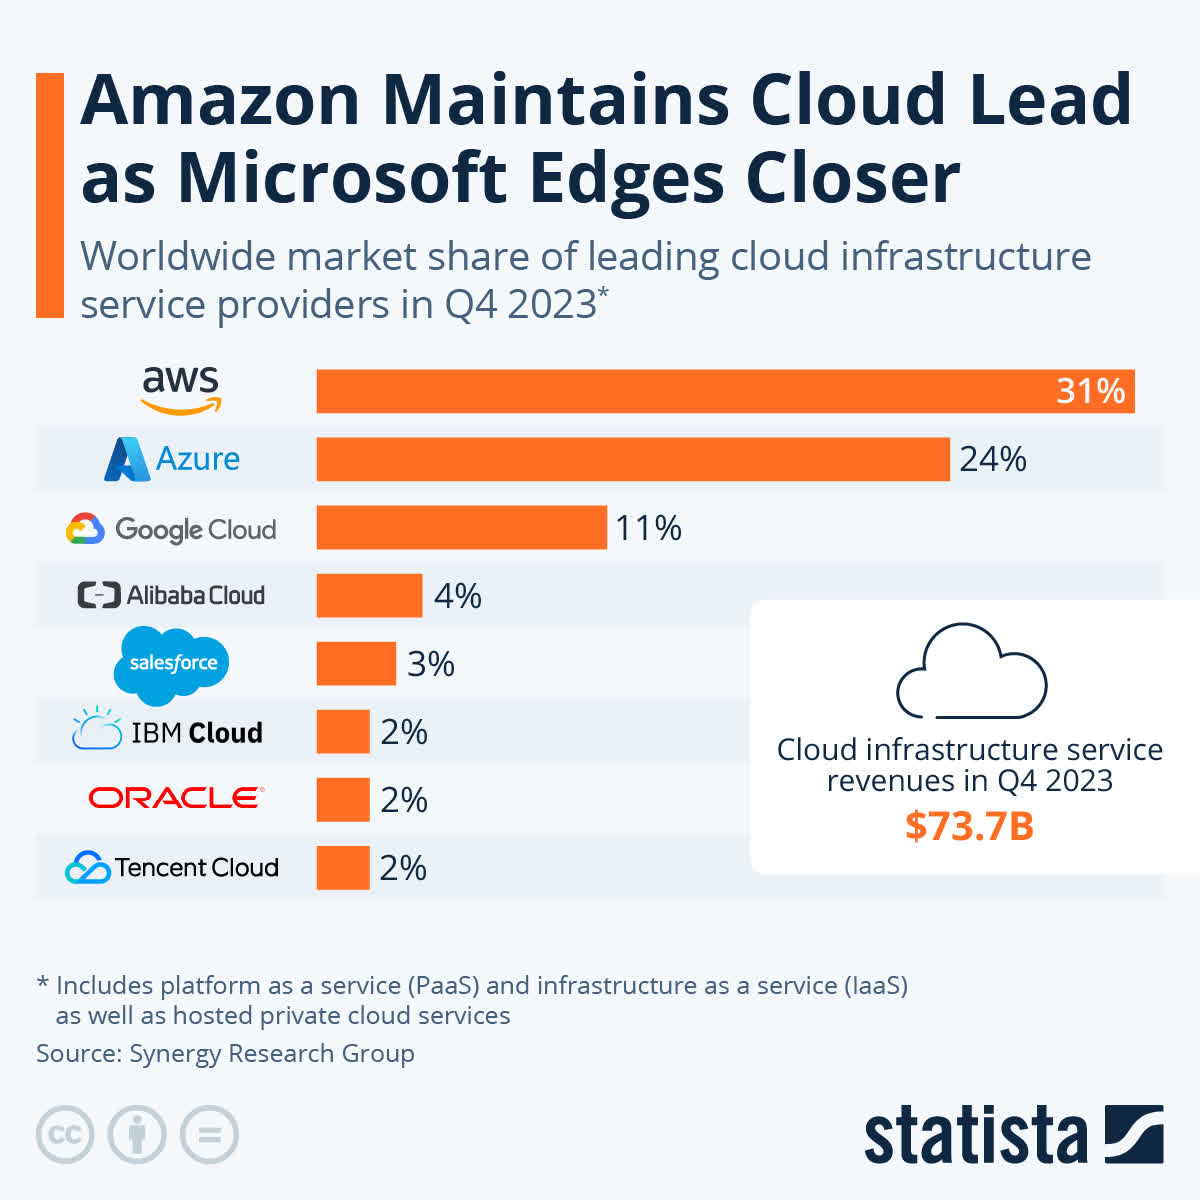
Then in what concerns office products, Microsoft holds around 30% of the market, behind Alphabet, inc. (GOOG)(GOOGL), which holds 44%. This is probably because Google’s version of Office is completely free, while Microsoft is paid and is often pirated.
Lastly, Windows remains unrivaled by holding a market share of around 72.17%, followed by Apple, Inc. (AAPL) which holds 15.42% of the market with its macOS operating system. Nevertheless, it’s worth noting that Windows has been losing market share to MacOS since January 2013, its market share stands at 90.96%.
Industry Outlook
Microsoft’s productivity & business processes segment comprises Office 365 subscriptions, on-premise Office Licenses, LinkedIn subscriptions, and Dynamics 365 intelligent cloud. The business productivity software market is expected to reach a valuation of $59.27B in 2024 and grow by 15.29% annually until 2029 when it’s expected to reach a valuation of $120.52B
Then, there is Microsoft’s intelligent cloud segment, through which Microsoft offers Azure, SQL Server, Windows Server, Visual Studio, System Center, and related Client Access Licenses. The Worldwide Public Cloud market is expected to generate around $282.2B in revenue for 2024 and grow at a CAGR of 11.37% throughout 2028 when it’s estimated to generate around $1.06T in revenues.
Lastly, there is Microsoft’s More Personal Computing segment which is very diversified, since it offers the Windows operating system, Surface devices, HoloLens, and other PC accessories such as mice and keyboards, as well as the XBOX gaming console, Microsoft News Microsoft Edge and Bing search engine.
Valuation
To value Microsoft, I will employ a DCF model. In the table below, you can observe the necessary financial information for doing so. The WACC was calculated with the already-known formula. In the case of Microsoft, the result came out at 11.28%. If you want to see a more detailed process, you can observe the section labeled “WACC Calculation” in the DCF model. Furthermore, D&A and CapEx will be tied to margins tied to revenue, which came out at 6.04% and 15.47% respectively.
| TABLE OF ASSUMPTIONS | |
| (Current data) | |
| Assumptions Part 1 | |
| Equity Market Value | 3,160,000.00 |
| Debt Value | 111,358.00 |
| Cost of Debt | 2.21% |
| Tax Rate | 18.45% |
| 10y Treasury | 4.400% |
| Beta | 1.18 |
| Market Return | 10.50% |
| Cost of Equity | 11.60% |
| Assumptions Part 2 | |
| CapEx | 35,202.00 |
| Capex Margin | 15.47% |
| Net Income | 82,541.00 |
| Interest | 2,461.00 |
| Tax | 18,669.00 |
| D&A | 13,742.00 |
| Ebitda | 117,413.00 |
| D&A Margin | 6.04% |
| Interest Expense Margin | 1.08% |
| Revenue | 227,583.0 |
The first step is to calculate revenue. To do this, I will first imply that Productivity & Business Process will grow at a pace of 15.25% annually in line with the respective market, whereas Intelligent Cloud will grow at 15.66% annually, also in line with its respective market.
In my future models covering Microsoft, I will continue to put Activision as a separate segment because I knew how much it earned before it got delisted. This gives more precision to the model. For Activision, I am implying a revenue growth rate of 5.2% for 2025-2029. This was the expected forward revenue growth rate when there were still estimates available for Activision. After the acquisition, Activision operations probably got added into the “More Personal Computing” segment, since Microsoft’s XBOX operations are there. This last segment will grow at a pace of 5.56% annually, which is its historical growth rate from 2018 to 2023.
| Revenue Activision | Productivity & Business Processes | Intelligent Cloud | More Personal Computing | |
| 2023 | 8,706.00 | 69,275.01 | 87,902.34 | 54,737.64 |
| 2024 | 8,706.00 | 79,839.45 | 101,667.85 | 57,781.06 |
| 2025 | 9,158.71 | 92,014.97 | 117,589.03 | 60,993.68 |
| 2026 | 9,634.97 | 106,047.25 | 136,003.48 | 64,384.93 |
| 2027 | 10,135.98 | 122,219.46 | 157,301.62 | 67,964.74 |
| 2028 | 10,663.05 | 140,857.93 | 181,935.05 | 71,743.57 |
| 2029 | 11,217.53 | 162,338.76 | 210,426.08 | 75,732.52 |
| % Of Revenue | 32.69% | 41.48% | 25.83% | |
| Growth Rate % | 15.25% | 15.66% | 5.56% |
Author’s Calculations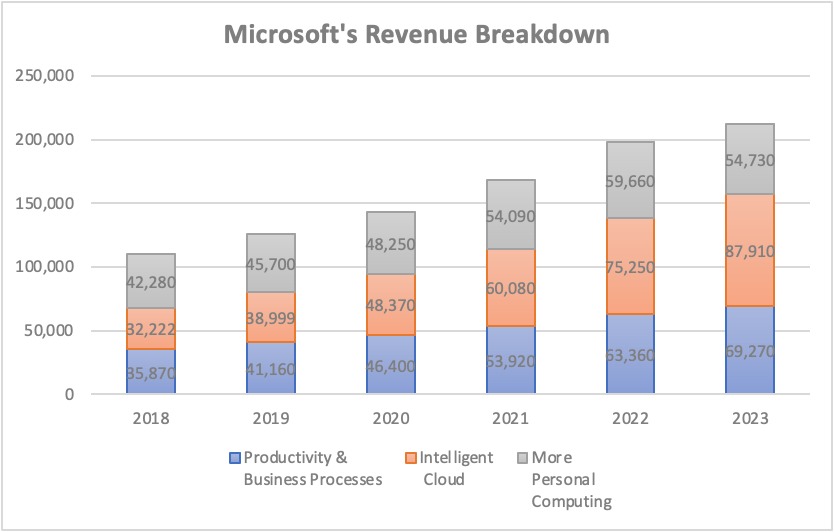
Then heading toward net income calculation, I will use the available estimates that were available for Activision before it got delisted. This was a Non-GAAP net income of $2.16B for 2024 and $2.35B for 2025. Then it’s going to grow at the 3-5y long-term EPS growth rate of 8.93% during 2026-2029.
| Net Income Activision |
| 2,166.00 |
| 2,166.00 |
| 2,359.42 |
| 2,570.12 |
| 2,799.63 |
| 3,049.64 |
| 3,321.97 |
For Microsoft, I will use the average net income margin for 2020-2024TTM of 34.90% to predict net income. During that period Microsoft’s net income margin never went below 30% and for 2021-2024TTM, it never went below 34%.
Author’s Calculations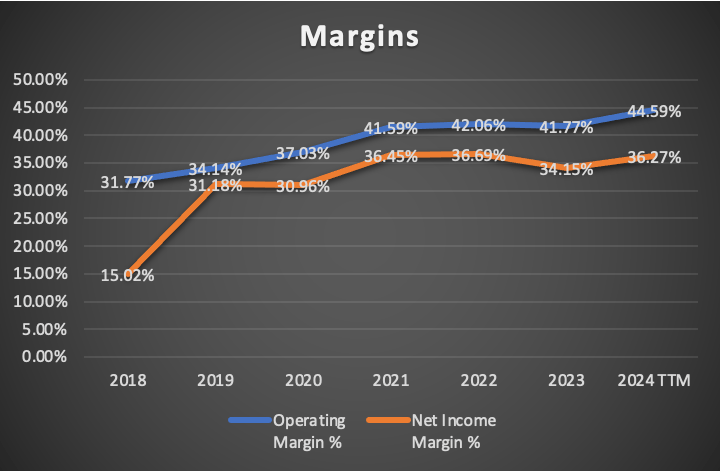
| Revenue | Net Income | Plus Taxes | Plus D&A | Plus Interest | |
| 2024 | $247,994.4 | $88,716.03 | $105,080.42 | $120,054.90 | $122,515.90 |
| 2025 | $279,756.4 | $99,994.41 | $118,439.18 | $133,413.67 | $136,164.60 |
| 2026 | $316,070.6 | $112,878.77 | $133,700.17 | $152,785.26 | $155,860.29 |
| 2027 | $357,621.8 | $127,609.64 | $151,148.27 | $172,742.32 | $176,179.62 |
| 2028 | $405,199.6 | $144,464.30 | $171,111.91 | $195,578.82 | $199,421.08 |
| 2029 | $459,714.9 | $163,762.47 | $193,969.78 | $221,728.45 | $226,023.37 |
| ^Final EBITA^ |
Finally, before going to the results, I will suggest which could be the stock price for 2029. To do this, I will imply that each of the elements that compose equity, will continue to evolve at the pace displayed in 2021-2024TTM. This means that short-term debt will grow by 35.4% annually, long-term debt will decrease by 3.4% annually, current assets will grow by 2.9%, and marketable securities by 6.4% annually. This last one corresponds to the period 2018-2021, since in the period of 2021-2024TTM, cash reserves increased by 156.4% annually, which if used would mean that by 2029 Microsoft would have marketable securities by $7.06T, something very unrealistic. Then I just use the undiscounted cashflows to get an undiscounted company value.
Author’s Calculations
As you can see, the model suggests a present fair price of $397.49, which is 6.6% lower than the current stock price of $425.52. The future price suggested stands at around $701.68, which is a 64.9% upside from the current stock price, however when divided by the number of years in this projection (which is 6), it translates into 10.8% annual returns, which is nearly in-line with the average market performance.
How do My Estimates Compare with the Average Consensus?
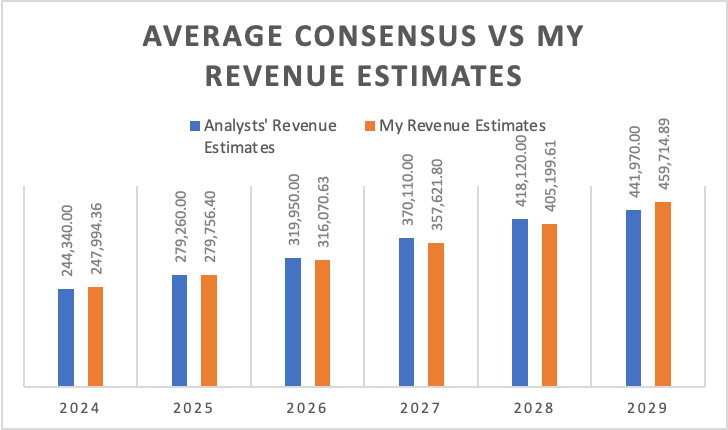
My EPS estimates are over 1.81% lower when compared to the average consensus. For 2024, my EPS target is 2.03% higher, for 2025, that difference narrows to 0.86%, and for 2029, it is 2.54% higher. However, for 2026, 2027, and 2028 they are lower, more specifically, 2.83%, 6.53%, and 5.27% respectively. The reason for this is a mix of my revenue targets, which are 0.36% lower than the average consensus, and net income margins.
Author’s Calculations Author’s Calculations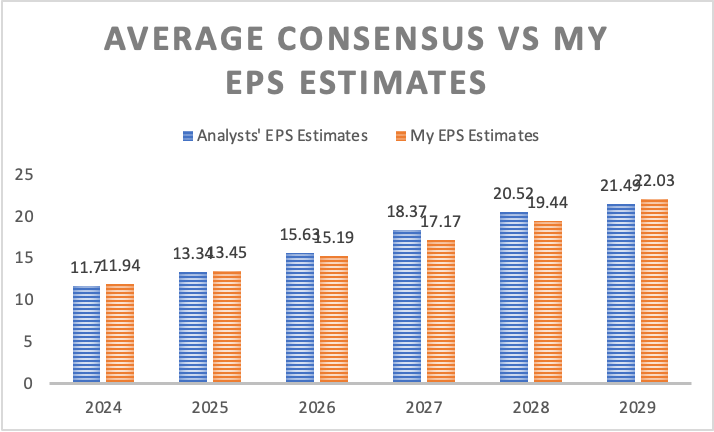
What does Microsoft need to be undervalued?
For the stock to offer a 12.4% near-term upside and 16.5% annual returns throughout 2029, EPS estimates need to be significantly higher. More precisely, for 2024, EPS estimates would need to be 29.01% over the average consensus and for 2025, they need to be around 30.81% higher.
Author’s Calculations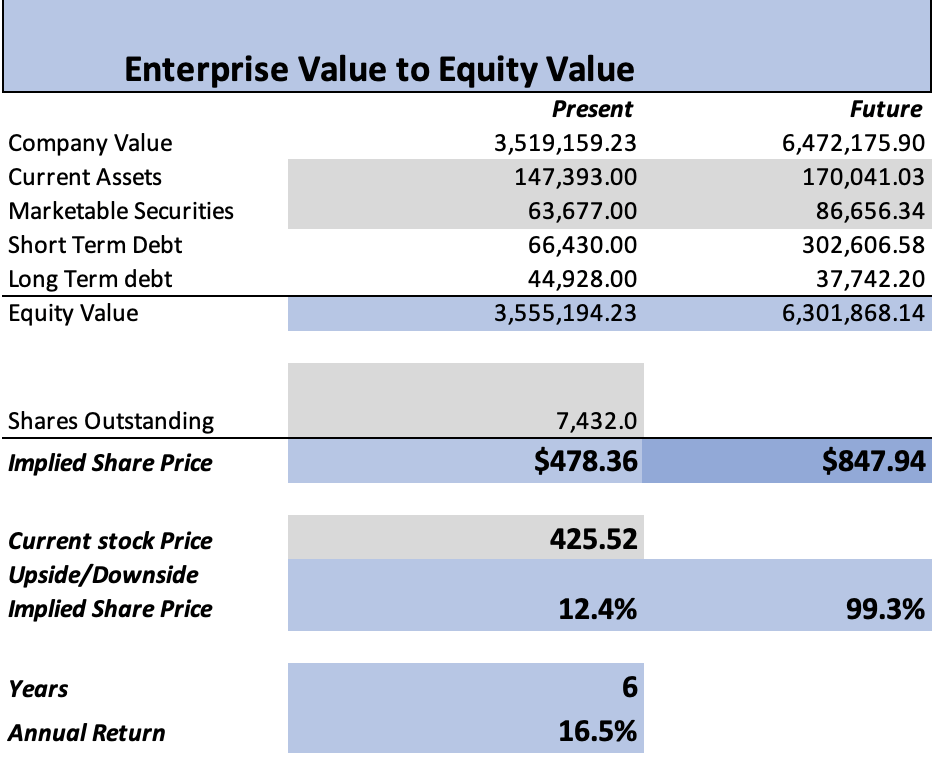
Nevertheless, if Microsoft can achieve an EPS of $3.77 for Q3 2024, consider this article to change in an automatic buy since it would mean that estimates for subsequent quarters would be revised upwards.
| Analysts’ EPS Estimates | Required EPS Estimates For a Decent Opportunity | % Difference | |
| 2024 | 11.7 | 15.09 | 29.01% |
| 2025 | 13.34 | 17.45 | 30.81% |
| 2026 | 15.63 | 19.19 | 22.78% |
| 2027 | 18.37 | 21.17 | 15.24% |
| 2028 | 20.52 | 23.44 | 14.23% |
| 2029 | 21.49 | 26.03 | 21.13% |
Risks to Thesis
The main risk to my thesis, a somewhat bearish thesis, is that Microsoft can achieve the optimistic targets previously mentioned to be undervalued by 2.4%. Nevertheless, I consider it highly unprobable since I don’t know of any current near-term growth catalyst that could benefit Microsoft.
Then, there’s always the risk of market sentiment which is clearly in favor of Microsoft since, up to now, has been steadily increasing and adjusting to the previous targets I set in my previous coverages. This means that optimism is on Microsoft’s side and therefore, even though I am saying that Microsoft is now slightly overvalued, the stock could still climb.
Conclusion
In conclusion, it appears that Microsoft is now solidly anchored in the “fairly valued” category. It would take a significant effort on the part of Microsoft to change that, since as previously discussed, Microsoft would need to exceed average EPS estimates by 20-30%.
After concluding the valuation process, I arrived at a fair price estimate of $397.49, which represents a 6.6% downside from the current stock price of $425.52. The future stock price for 2029, is still way higher than the current stock price, by around 64.9%. However, when dividing that by 6, it means that during 2024-2029, the stock would be delivering annual returns of 10.8%, which is almost the same as the average return of the overall market. For those reasons, I am downgrading the stock to a “Hold”.
Analyst’s Disclosure: I/we have no stock, option or similar derivative position in any of the companies mentioned, but may initiate a beneficial Long position through a purchase of the stock, or the purchase of call options or similar derivatives in MSFT over the next 72 hours. I wrote this article myself, and it expresses my own opinions. I am not receiving compensation for it (other than from Seeking Alpha). I have no business relationship with any company whose stock is mentioned in this article.
Seeking Alpha’s Disclosure: Past performance is no guarantee of future results. No recommendation or advice is being given as to whether any investment is suitable for a particular investor. Any views or opinions expressed above may not reflect those of Seeking Alpha as a whole. Seeking Alpha is not a licensed securities dealer, broker or US investment adviser or investment bank. Our analysts are third party authors that include both professional investors and individual investors who may not be licensed or certified by any institute or regulatory body.