
Summary:
- Salesforce announced an additional buyback of $10 billion last week.
- The buyback represented around 6% of its market cap at announcement.
- Salesforce spent $2.3 billion on stock buybacks in Q4 2023 and $4 billion for the full fiscal year 2023.
JHVEPhoto
After years of diluting shareholders (30% over four years to be precise), Salesforce (NYSE:CRM) has suddenly gotten buyback fever and announced an additional buyback of $10 billion last week. The buyback represented around 6% of its market cap at announcement. Salesforce announced its first-ever $10 billion buyback last year in August and upgraded it to $20 billion on March 1, 2023.
Since that announcement last year, the company has repurchased a smidgen of stock after taking stock-based compensation into account, which was an astounding $809 million last quarter. For fiscal 2023, which ended in January 2023, the company had $3.28 billion in stock-based compensation expenses, a record for the company. Shareholders were left with a paltry $208 million in GAAP net income. It is not surprising that there was a management shakeup at the company and not one, but six activists are involved as we cover later in this article.
The company’s share price peaked in November 2021 at over $300 per share and at its trough last December had dipped to below $130. We saw a rebound this year as we have seen with the entire tech sector and the stock currently trades at $183.32.
Surprisingly, buyback activity dropped significantly last week with 16 companies announcing buybacks compared to 28 companies in the prior week. This is inclusive of a bunch of accelerated share repurchase (ASR) agreements executed by a few companies. The most significant was a $2.5 billion ASR by Verisk Analytics, Inc. (VRSK).
Tweet on Verisk Analytics announcing $2.5 billion Accelerated share repurchase transaction (Twitter @InsideArbitrage)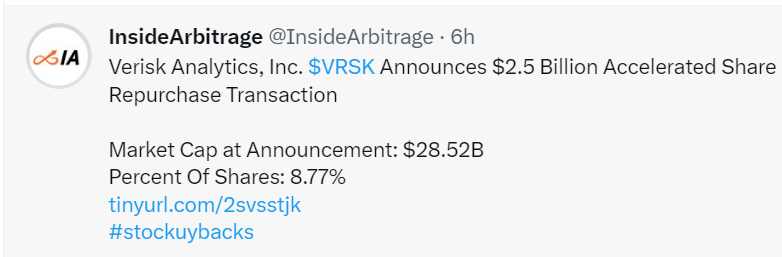
C-Suite Management Changes at Salesforce:
Salesforce recently saw the departures of several top-level executives. Among those who left the company were the Co-CEO and Chief Strategy Officer as well as two CEOs of the company’s Tableau and Slack divisions. We covered these personnel departures in our article, C-Suite Transitions – Management Shakeup At Salesforce.
In January 2023, Salesforce laid off around 8,000 employees which was about 10% of its staff. Despite taking measures to control expenses, it was interesting to see that the company agreed to pay actor and producer, Matthew McConaughey, $10 million a year to serve as its “creative advisor and TV pitchman”.
Activists’ Involvement:
Salesforce has been under pressure from a group of activists forcing it to implement considerable cost cuts by working on employee pay and expensive acquisitions. In October ’22, Starboard Value accumulated an undisclosed stake in the company. Later on, other activists, such as Elliott Investment Management, ValueAct, Inclusive Capital, Third Point, and Strive Asset Management (most recent) joined the list. Hopefully, the involvement of these activists will prove beneficial for shareholders in the long run.
Q4 2023 Results:
Salesforce had a strong fiscal fourth quarter, beating both revenue and earnings growth forecasts. Salesforce grew revenues at double-digits in the fourth quarter as well as for the full year. It generated revenue of $8.4 billion, registering 14% year-over-year growth, with more than 92% of its revenues coming from subscriptions. For the full year, it delivered $31.4 billion in revenue, up 18% year-over-year.
Salesforce reported an operating margin of 4.3% for Q4 2023, which was substantially better than the negative 2.4% reported in Q4 2022. The company generated free cash flow of $2.57 billion in Q4 and $6.3 billion for the full year, showing 41.6% and 19% year-over-year growth respectively. The company ended fiscal 2023 (ended January 2023) with operating cash flow reaching $7.1 billion, up 19% year-over-year, the highest cash flow in its history.
Total quarterly revenue and operating margin for Salesforce (Salesforce – Investor presentation)
Share Repurchases:
Salesforce spent $2.3 billion on stock buybacks in Q4 2023 and $4 billion for the full fiscal year 2023. This represents more than 60% of its free cash flow for fiscal 2023. The nearly unchanged number of shares outstanding from earlier in its fiscal year clearly shows that they are using share repurchases mostly as a means to offset dilution from stock-based compensation.
change in shares outstanding for Salesforce (InsideArbitrage)
Amy Weaver, President & CFO of Salesforce mentioned,
“I’m pleased that the Board has approved an increase to our share repurchase authorization from $10 billion to $20 billion. As a result, we now expect to fully offset our stock-based compensation dilution through our share repurchases in fiscal year ’24.”
Strong Profitability & Growth:
Salesforce is highly profitable with a gross margin of over 70% and a levered FCF margin of around 34%. The company has grown its revenue and levered FCF at a CAGR of around 25% and over 30% respectively over the last 5 years. The company beat revenue and EPS estimates for the last eight quarters. We have seen 28 upward revisions from analysts in the company’s earnings estimate over the last 90 days.
The Bottom Line:
The recent changes we have seen at Salesforce indicate that shareholders might finally get a chance to get into the front seat of the car instead of being relegated to a cramped and hot third row. The company continues to innovate as we saw recently from its plans to launch EinsteinGPT. This feature aims to integrate the popular ChatGPT technology with Salesforce’s Einstein AI.
Net debt is a modest $1.58 billion and the stock trades at a forward EV/EBITDA of 18.28 and forward P/E of 29.85. The company is expected to grow revenue by 10% to $34.62 billion and by $38.45 billion in fiscal ’24 and ’25, ending January 2024 and 2025 respectively.
The companies in the list below are the ones that announced the most significant buybacks as a percentage of their market caps. They are not the largest buybacks in absolute dollar terms. A word of caution. Some of these companies could be low-volume small-cap or micro-cap stocks with a market cap below $2 billion.
Top 5 Stock Buyback Announcements
1. Solaris Oilfield Infrastructure, Inc. (SOI): $9.98
On March 2, 2023, the Board of Directors of this oil & gas field equipment manufacturer, authorized a new $50 million share repurchase program, equal to 11.3% of its market cap at announcement.
| Market Cap: $452.24M | Avg. Daily Volume (30 days): 268,158 | Revenue (TTM): $320M |
| Net Income Margin (TTM): 6.61% | ROE (TTM): 10.9% | Net Debt: $11.65M |
| P/E: 14.31 | Forward P/E: N/A | EV/EBITDA (TTM): 5.65 |
2. Vistra Corp. (VST): $26.51
On March 6, 2023, the Board of Directors of this retail electricity and power generation company, approved an additional $1 billion share repurchase program equal to 10.7% of its market cap at announcement.
| Market Cap: $10.11B | Avg. Daily Volume (30 days): 434,607 | Revenue (TTM): $13.73B |
| Net Income Margin (TTM): -8.94% | ROE (TTM): -18.32% | Net Debt: $12.88B |
| P/E: N/A | Forward P/E: 8.76 | EV/EBITDA (TTM): 27.51 |
3. Crescent Point Energy Corp. (CPG): $7.02
On March 7, 2023, the Board of Directors of this oil and gas company, with TSX approval, authorized a new 54.6 million share repurchase program, equal to 10% of its market cap at announcement.
| Market Cap: $3.85B | Avg. Daily Volume (30 days): 1,222,029 | Revenue (TTM): $2.95B |
| Net Income Margin (TTM):37.15% | ROE (TTM): 24.93% | Net Debt: $942.21M |
| P/E: 2.67 | Forward P/E: 5.4 | EV/EBITDA (TTM): 2.23 |
4. Verisk Analytics, Inc.: $184.15
On March 7, 2023, the Board of Directors of this data analytics solutions provider authorized an accelerated share repurchase of $2.5 billion of the company’s Class A common stock, equal to 8.8% of its market cap at announcement.
| Market Cap: $28.49B | Avg. Daily Volume (30 days): 76,763 | Revenue (TTM): $2.50B |
| Net Income Margin (TTM): 38.2% | ROE (TTM): 45.21% | Net Debt: $3.84B |
| P/E: 26.98 | Forward P/E: 31.55 | EV/EBITDA (TTM): 25.91 |
5. Visteon Corporation (VC): $165.74
On March 7, 2023, the Board of Directors of this automotive technology company authorized a new $300 million stock buyback program, representing around 6.4% of its market cap at announcement.
| Market Cap: $4.67B | Avg. Daily Volume (30 days): 325,572 | Revenue (TTM): $3.76B |
| Net Income Margin (TTM): 3.3% | ROE (TTM): 18.71% | Net Cash: $43M |
| P/E: 39 | Forward P/E: 22.52 | EV/EBITDA (TTM): 15.60 |
Disclosure: I/we have no stock, option or similar derivative position in any of the companies mentioned, and no plans to initiate any such positions within the next 72 hours. I wrote this article myself, and it expresses my own opinions. I am not receiving compensation for it. I have no business relationship with any company whose stock is mentioned in this article.
A Combination Of Tools And Analysis For Event-Driven Strategies.
For over a decade we built tools to help event-driven investors that focus on strategies like merger arbitrage. The Inside Arbitrage service provides the best combination of tools and analysis for various event-driven strategies like risk arbitrage, spinoffs and SPACs.
We also track insider purchases and companies that are buying back their own stock while their insiders are making open market purchases. We use these strategies for idea generation and then do detailed work to identify opportunities for our model portfolio and personal portfolios. Click here to learn more.