
Summary:
- Sticky business model bodes well for the recurrent business, without shying away from bets on the disruptive AI technology.
- Technical set up is conducive to a turnaround.
- Structural changes in management, positive guidance, as well as a doubled share repurchase programme may change the feelings towards the company.
courtneyk
Investment Thesis
A healthy revenue growth combined with a positive technical setup after the huge correction of the last year makes Salesforce, Inc. (NYSE:CRM) a Strong Buy suggestion.
Fiscal Year 2023 Results
Salesforce had a strong fiscal Q4 2023, exceeding revenue and earnings growth projections. Salesforce’s revenue increased by double digits both in Q4 and the full year 2023. It made $8.4 billion in revenue in Q4, up 14% YoY, with subscriptions accounting for more than 92% of its revenue. It generated $31.4 billion in revenue for the entire year, an increase of 18% year on year.
FY 2023 results (Q4 FY23 Earnings Presentation)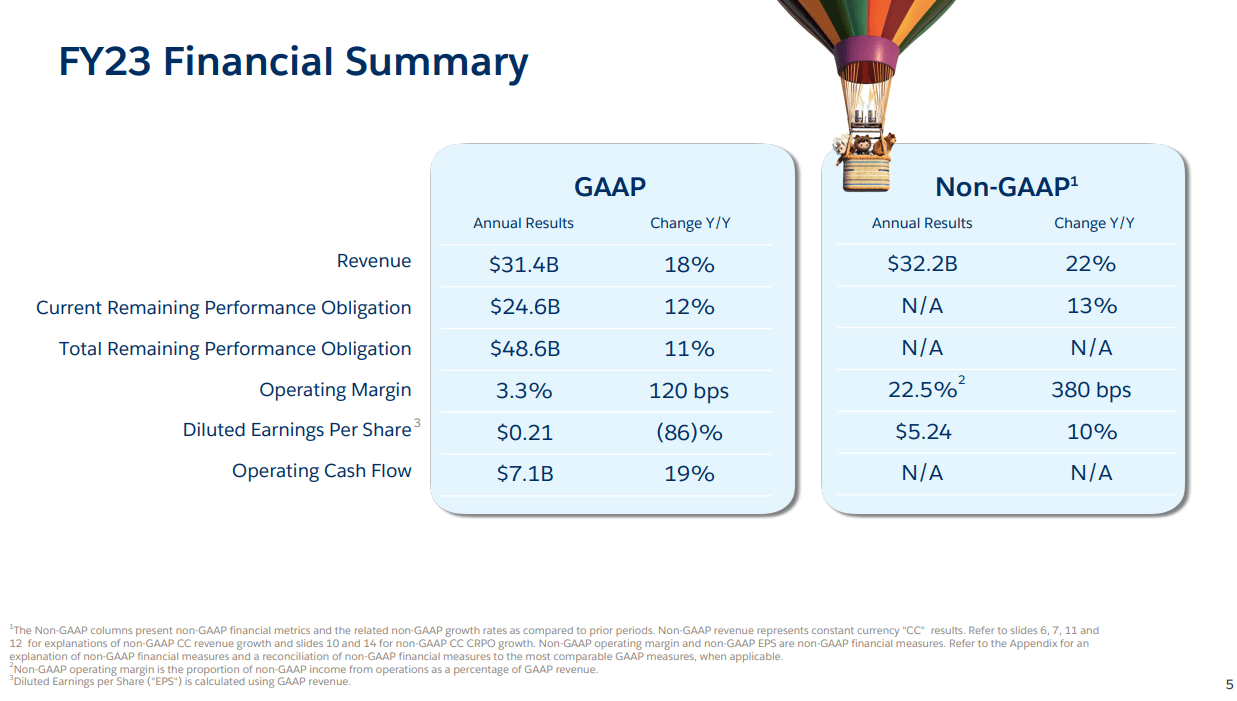
As for the geographical spread, the company reported $5.657 billion in revenue (from the Americas) in Q4 alone, an increase of 15% YoY. EMEA is its second largest region, accounting for 23% of revenue or $1.935 billion in Q4 (20% year over year in constant currency). Its third segment, APAC, contributed 9.38% of total revenue or $792 million, increasing by a consistent 18% year over year (equivalent to 30% in constant currency).
Salesforce performed particularly well in its platform business, which saw the most growth in the company’s portfolio. Platform & Other, which builds and customizes applications for enterprise customers, saw revenue increase 32% YoY to $6.0B in FY 2023. Platform & Other is now Salesforce’s third-largest business. Salesforce’s other core businesses also performed well, with topline growth rates of 14% in FY 2023 for both Sales and Service segments.
Revenues by Segments (Q4 FY23 Earnings Presentation)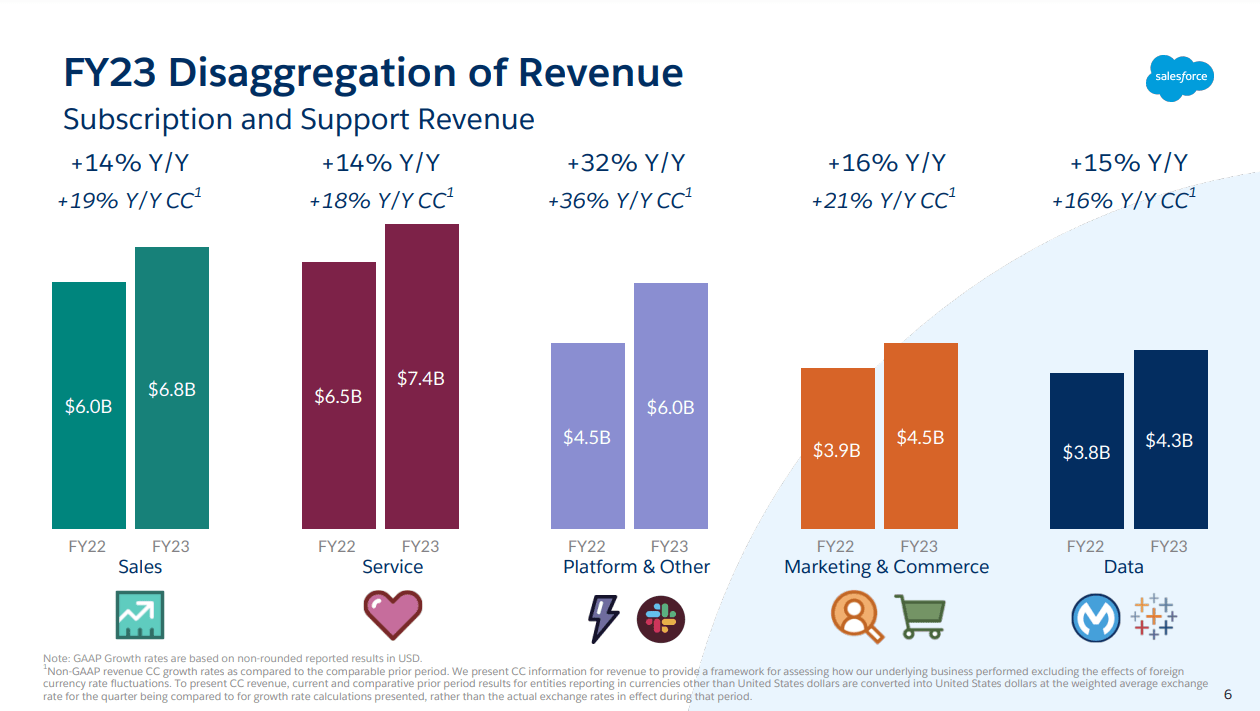
Salesforce reported an operating margin of 4.3% for Q4, a significant improvement by 670 bp over Q4 2022. The company generated $2.57 billion in free cash flow in Q4 and $6.3 billion for the full year, representing 41.6% and 19% YoY growth, respectively. The company ended fiscal 2023 (ended January 2023) with $7.1 billion in operating cash flow, up 19% YoY, the highest cash flow in its history.
In August of last year, Salesforce announced its first-ever $10 billion buyback, which was increased to $20 billion on March 1, 2023.
Growth Drivers
Salesforce Data Cloud has proven to be extremely popular, with $1.3 billion in revenue generated in Q4 2023, an increase of 18% YoY. This is essentially a customer data platform that assists organizations in bringing siloed data from multiple sources together. Data Cloud can then be used to generate a “customer graph,” which aids in the identification of relationships between various factors to derive insights. Salesforce is well-positioned to capitalize on the big data industry trend, as its customers seek solutions to extract insights from their “big data.”
Salesforce recently (March 7) announced plans to release EinsteinGPT. The goal is to combine the viral ChatGPT technology (based on the GPT-3 model) with Salesforce’s Einstein AI on the company’s legacy platform. The goal of this is to assist salespeople in generating reports and capturing lead information. ChatGPT has been also added to Slack.
As for the guidance for FY 2024, the Salesforce management expects to see about 10% revenue growth for Q1 2024 and the same 10% topline growth rate for FY 2024. Growing profitability could be a key driver of Salesforce’s stock appreciation in the future.
Explanation of My Technical Analysis Toolbox
I will analyze Salesforce from a perspective of a number of technical analysis tools and show the screenshots on the monthly and weekly Heikin Ashi candles charts – each timeframe presented through two separate sets of indicators – which I will complement with a simplified daily Renko chart to reflect the short-term price momentum
The first chart setup (I will call it Chart 1) uses Bill William’s Alligator indicator and Awesome Oscillator, as well as Ichimoku Clouds and On Balance Volume indicator line. For fundamentals, I show the quarterly revenue trend which I use for quick visual triage.
The Alligator technical analysis tool uses three smoothed moving averages that are based on thirteen, eight, and five periods, called also Jaw (blue line), Teeth (red line), and Lips (green line), respectively. Due to the smoothing of each moving average, the Jaw makes the slowest turns and the Lips make the fastest turns. The Lips crossing down through the other lines signals a short opportunity while crossing upward signals a buying opportunity.
William’s Awesome Oscillator (AO) is a market momentum tool that visualizes a histogram of two moving averages, calculated on median prices of a recent number of periods compared to the momentum of a larger number of previous periods. If the AO histogram is crossing above the zero line, that’s indicative of bullish momentum. Conversely, when it crosses below zero, it may indicate bearish momentum.
As for the Ichimoku Cloud – I am not using a full set of lines of Ichimoku lines, only the Leading Spans A and B, whose crosses dictates the color of the cloud and whose individual lines provide levels of the strongest support and resistance lines. Ichimoku averages are plotted into the future which in its own right provides a clearer picture but have no predictive powers.
On-Balance-Volume (OBV) indicator is a volume-based tool and is supposed to indicate the crowd sentiment about the price. OBV provides a running total of an asset’s trading volume and indicates whether this volume is flowing in or out, especially when viewed in divergence with the price action.
The second chart setting (Chart 2) uses 2 moving averages (10- and 50-period), volume, and volume’s 20-period average. On the screenshot from top to bottom, you will see the Composite Index Divergence Indicator (CIDI), which I learned from the book of Constance Brown, as well as J. Welles Wilder’s Directional Movement Indicator (DMI). I also use MACD (Moving Average Convergence Divergence) which is well known to everybody: I seek crossovers of MACD and signal, as well as above/below the zero level.
CIDI comes from a combination of RSI with the Momentum indicator. For more literature, see Brown’s paper or read her book. CIDI has been developed to solve the problem of RSI not being able to show divergence. I personally use the CIDI’s crossover above and below its slow and fast-moving averages, as well as the position of the averages against each other.
As for DMI, I skip the ADX line because it doesn’t give me anything. Instead, I focus on the crossovers of the Positive Direction Indicator DI+ and Negative Direction Indicator DI-. When the DI+ is above DI-, the current price momentum is upwards. When the DI- is above DI+, the current price momentum is downwards.
On the use of Heikin Ashi candles and Renko boxes, I use them as tools for trend reversal and continuation identification. Renko charts do not have a time scale and they are built on price movements that must be big enough to create a new box or brick. Similar to Heikin Ashi, Renko charts filter the noise.
The Long-Term Trend
For the long-term trend analysis, I use monthly charts. We can observe in Chart 1 that since January, the monthly Heikin Ashi candles turned green. The March candle is crossing and will probably close above the Lips (green) Alligator’s line. The three lines of Alligator have flattened and seem to be bottoming. Although the projected Ichimoku Cloud is red, its lower edge has flattened as well slightly. The monthly Awesome Oscillators is in the negative territory and the two most recent bars have turned green. The On-Balance-Volume line has also picked up. The company boasts of a consistent growth of revenues which is visible on the bottom pane.
Monthly Chart 1 (TradingView)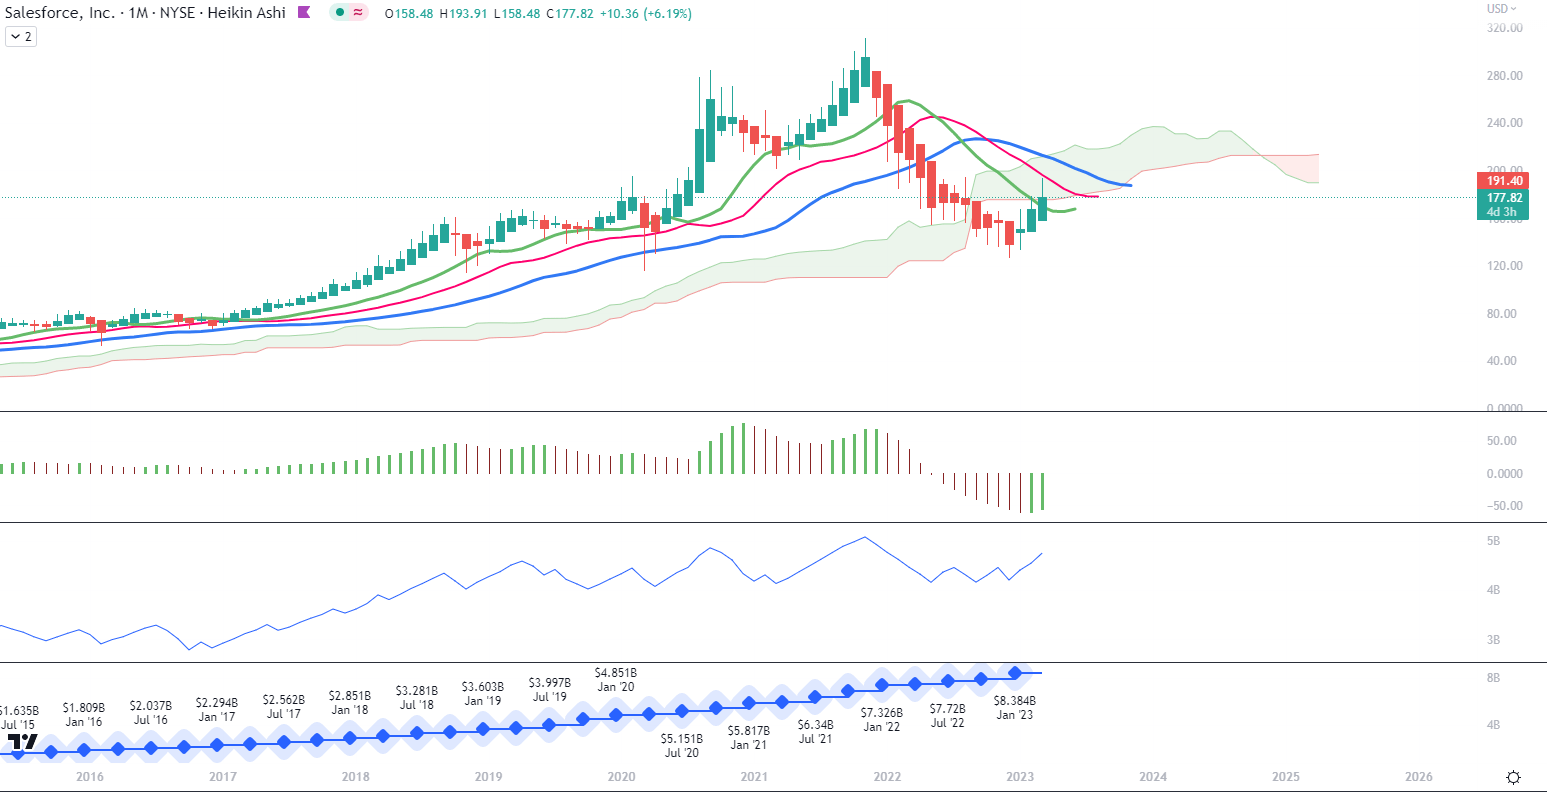
In Chart 2, We can notice that the third Heikin Ashi candle opened very close to the 10-month moving average. The 10-month moving average is making a U-turn and we can possibly expect that in the next 3-4 months it will cross above the 50-month moving average. The clearest signals of momentum are in CIDI as well as DMI. The former has crossed above its fast-moving average (green line) as well as above its slow-moving average (the orange line). The fast-moving average seems to have bounced off and is making an upwards U-turn. DI+ is currently crossing with the DI -, which for the last time happened in May 2020. The MACD line and its signal line are still in the negative territory, however, the MACD line has made a U-turn and is approaching its signal line. I would expect the crossing to happen in the next two months. What is worthwhile noticing is that the volume for January and March 2023 has crossed above the 20-month moving average.
Monthly Chart 2 (TradingView)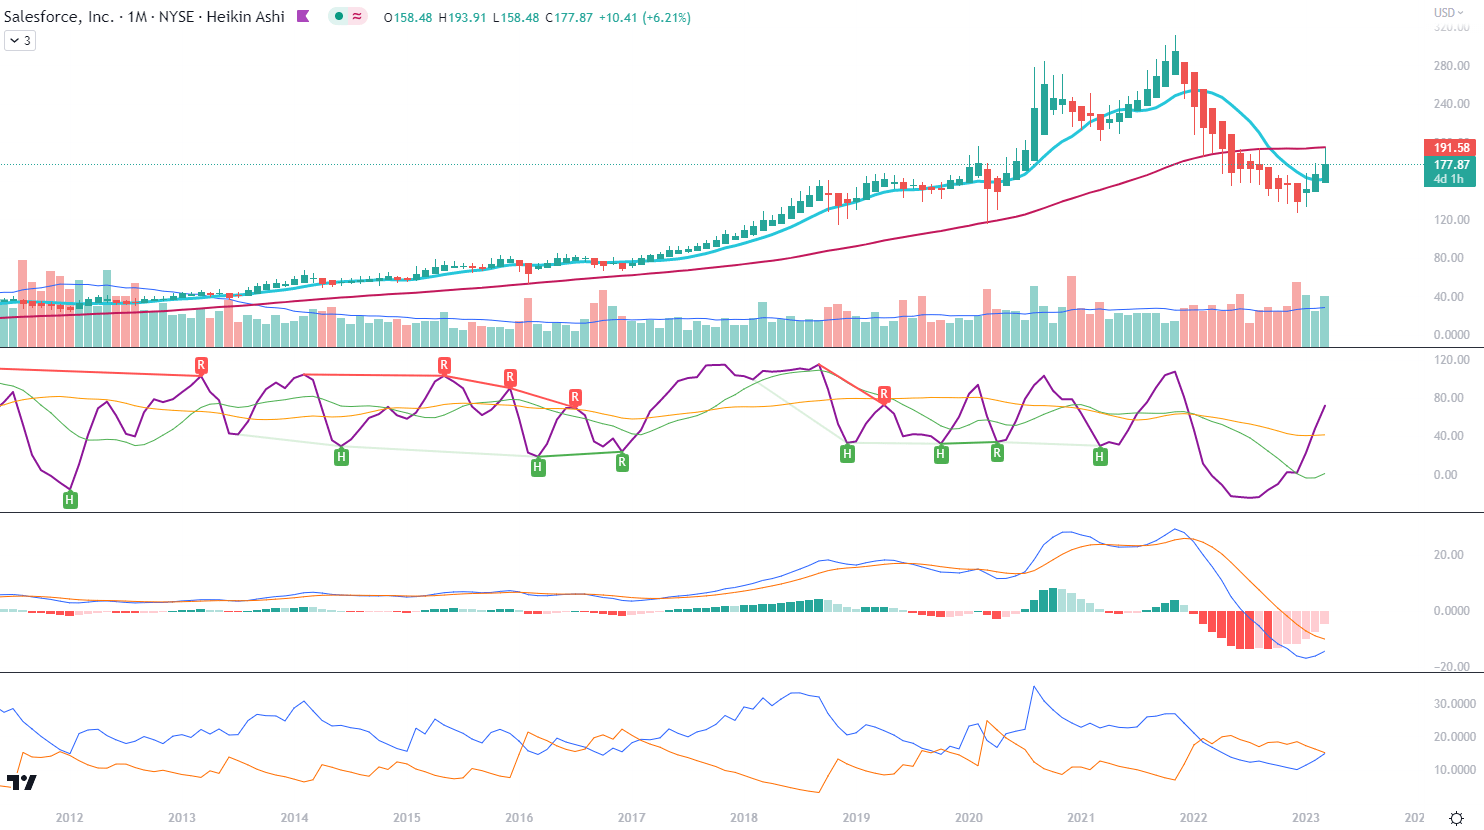
The Mid-Term Trend
For the mid-term trend analysis, I use weekly charts. In Chart 1, the technical signals of the trend reversal are quite pronounced, after the stock bottomed in December 2022. The Allilgator’s lines have all made an apparent uptrend crossing, that is to say, the Lips line (green) crossed above both Teeth (red) as well as Jaw (blue) lines, and the Teeth line crossed above the Jaw line as well. The Ichimoku Cloud is close to the turn of color from red to green, with the lower edge of the red cloud aggressively picking up. The weekly Awesome Oscillator crossed above the zero level in mid-February and has been constantly rising. On-Balance-Volume line has been rising since the end of the last year. On this time scale, the price of $174 seems to be the strongest support/resistance line and it overlaps with the recent upper edge of the red Ichimoku Cloud. In my opinion, the price still has the momentum to reach the level of $200 which seems to be a strong resistance line overlapping with the lower edge of the green Ichimoku cloud from the period of 2021. I would expect some profit-taking at this level.
Weekly Chart 1 (TradingView)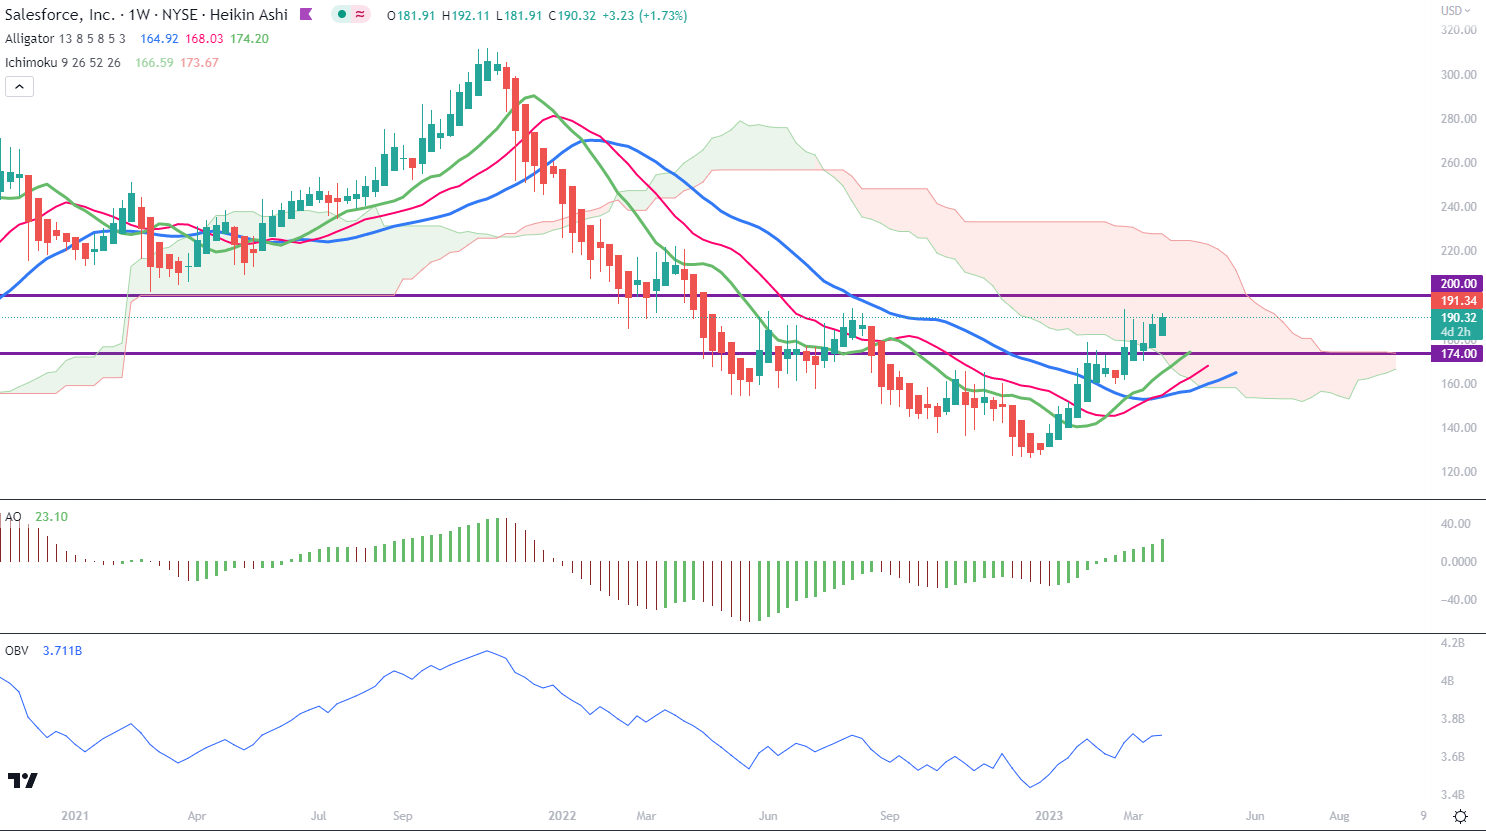
In Chart 2, we can see that the 10-week moving average has recently crossed above the 50-week moving average and the weekly green Heikin Ashi candles are consistently rising. The CIDI and DMI Play are both a kind of leading technical indicators in comparison to MACD. The CIDI line is flattening on the top and getting close to the green fast-moving average which could indicate an upcoming reversal of this mid-term trend. The weekly DI+ is above DI- but it has moved to a lower level. Only the weekly MACD is in the position of a new momentum with the recent cross above the zero level.
Weekly Chart 2 (TradingView)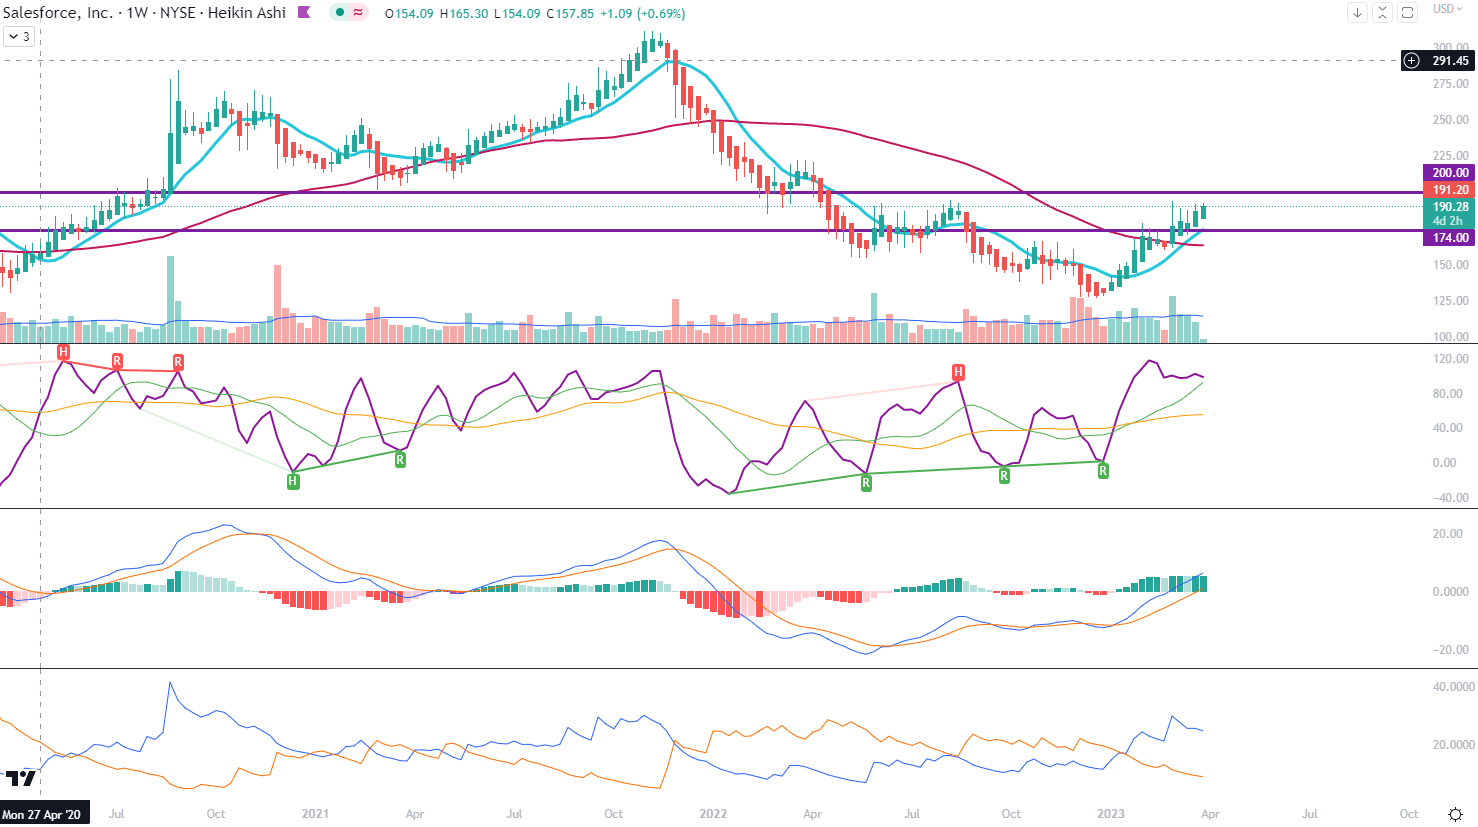
Price Momentum
In the daily Renko chart, we can see similar readings of the technical indicators as in the weekly Chart 2: the 10-week moving average has recently crossed above the 50-week moving average, while MACD has made a cross above the zero level at the beginning of March. Such a crossing took place last time at the beginning of June 2021.
Renko Daily (TradingView)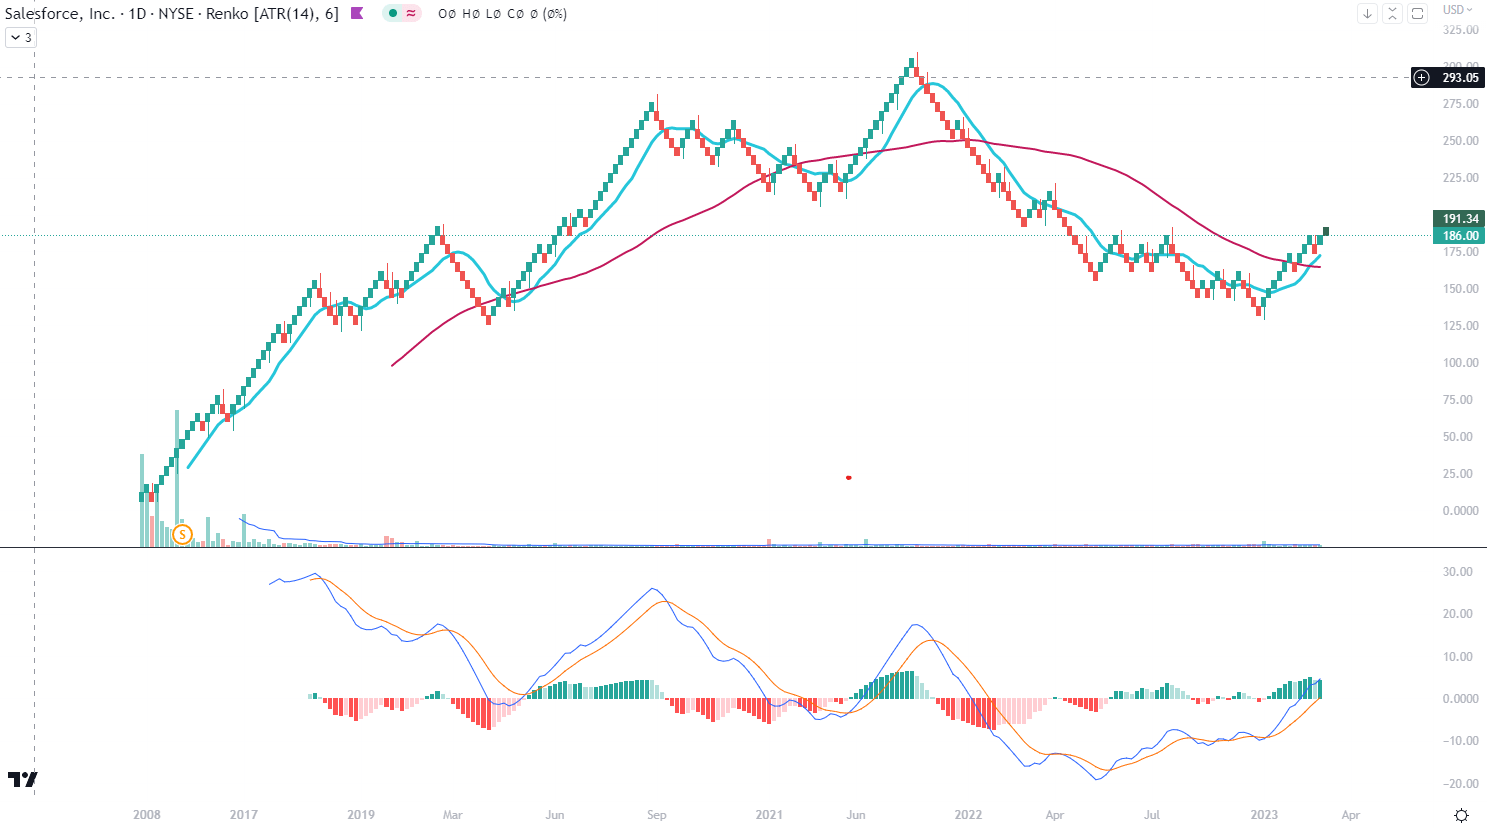
Conclusions
Beaten heavily last year together with the rest of the technology sector, Salesforce has undergone also some C-suite changes and interventions of the activists. Prospects of improving profitability, shares repurchases, sticky business, as well as a rising wave of technology stocks, put Salesforce in a position of tech stock to buy after the bottom. I opened my position last week.
Disclosure: I/we have a beneficial long position in the shares of CRM either through stock ownership, options, or other derivatives. I wrote this article myself, and it expresses my own opinions. I am not receiving compensation for it (other than from Seeking Alpha). I have no business relationship with any company whose stock is mentioned in this article.