
Summary:
- Salesforce is a global leader in CRM and sales automation software.
- The company serves an elite list of customers which includes Ford, L’Oreal, and the majority of the Fortune 1000.
- The Technical Chart of Salesforce shows positive bullish momentum, and the stock price is close to a “break out”.
- Salesforce beat both revenue and earnings estimates for the third quarter of fiscal year 2023.
wdstock
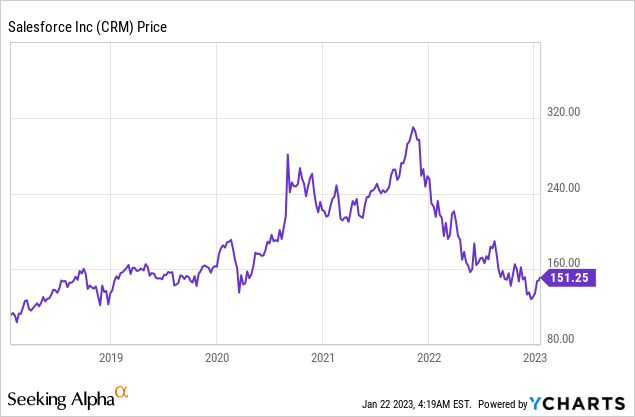
Salesforce (NYSE:CRM) is a software as a service company that pioneered the Customer Relationship Management (CRM) solution. In addition, its “sales automation” technology is now commonplace in the business world. Its technology uses advanced algorithms to score “leads” or prospective customers, which have the most likely “intent” to buy. This enables a Salesperson to focus their time more effectively. Gartner has Salesforce ranked as the number one sales automation platform, due to its solid leadership position with the enterprise. Despite the positivity surrounding Salesforce, its stock price was butchered by 57% from its all-time highs in November 2022. This was mainly driven by the macroeconomic environment and recession concerns. However, in the third quarter of the fiscal year 2023, the company beat analyst expectations for both the top and bottom line. In addition, its technical chart is looking positive, and the stock price is showing upwards momentum. In this post, I’m going to review its fundamentals before breaking down the technical charts, before revisiting my valuation model. Let’s dive in.
Financial Recap and Valuation
In a previous post on Salesforce I covered its third-quarter financials in granular detail, here is a quick recap. Salesforce reported strong financial results for the third quarter of the fiscal year 2023. The company reported revenue of $7.84 billion, which surpassed analyst expectations by $3.41 million and jumped by a solid 14% year over year. When I analyze past growth rates, I see the trend has been toward slowing growth. For example, the prior quarter’s growth rates were 21.77% YoY, 24.28% YoY, 25.94% YoY, 26.65%, etc. A slowing growth rate trend may seem extremely negative, but there are many macroeconomic factors at play. In the third quarter, Salesforce reported a substantial foreign exchange headwind, which impacted revenue from outside of the U.S. by approximately $300 million. On a currency-neutral basis, its growth rate was 19% year over year, which was slightly better.
Salesforce Revenue (Q3, FY23)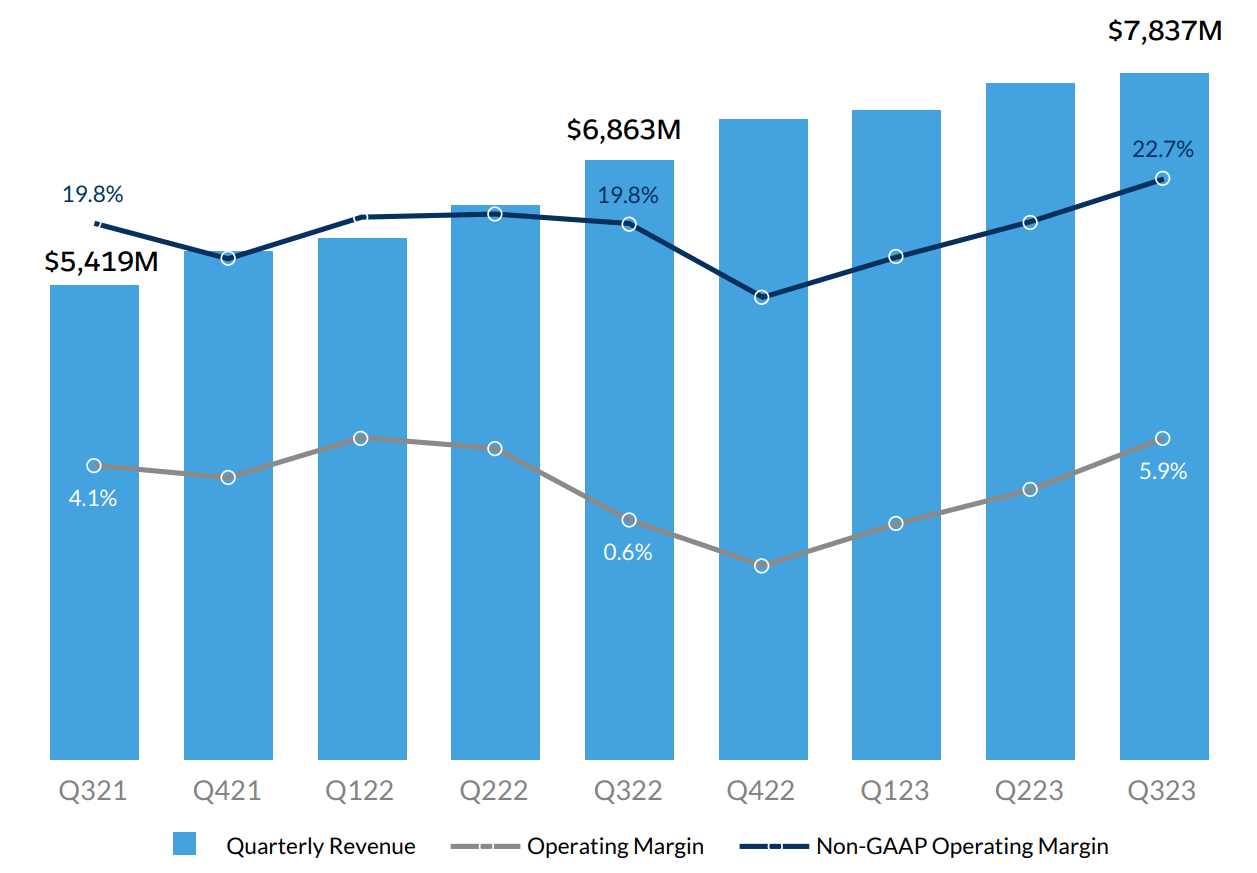
Salesforce has gradually grown its solutions from a single product to a ubiquitous multi-product platform. This is a brilliant strategy as it means upselling to its existing enterprise customer base is embedded. The Salesforce platform now includes Marketing (Pardot), Service, Slack (chat platform) and even Data applications. One of my favorite acquisitions by Salesforce was Tableau, the data visualization pioneer, which was acquired in 2019 for $15.7 billion. The big data industry was valued at $163.5 billion in 2021 and is forecast to grow at a 12.7% compounded annual growth rate, reaching an expected value of $473.6 billion by 2023. For extra information, Salesforce has a robust balance sheet with $11.9 billion in cash, cash equivalents and marketable securities. The company does have high long-term debt of $9.4 billion, but only $1.18 billion of this is “current” or short-term debt, thus this is manageable.
Balance Sheet (Q3, 2022 Report)
Technical Charts
Generally, when analyzing a stock, I tend to focus on the “fundamentals” – revenue, earnings, etc. However, it also makes sense to review the technical charts in order to identify solid entry points, from historic buying data. If you haven’t read technical charts before, don’t worry, I will walk you through it step by step, as I find many traders/investors try to “impress” others with their “knowledge” rather than actually help others. Starting on the left side of the chart below, I have added an indicator called a “Fibonacci Retracement”, identified by the colored lines. These lines are used as an “indication” of potential “Support” and “Resistance” lines based on past buying behavior. The bottom right of the chart shows the stock price “floor”, which is a support line/zone between $126-$130/share. The stock price bounced off this level in December 2022, which correlates to the stock price low in March 2020 (pandemic market crash). This also matches with a stock price low in 2018, and thus, I would deem this to be a strong support overall.
Salesforce Technical Chart 1 (Created by author Deep Tech Insights)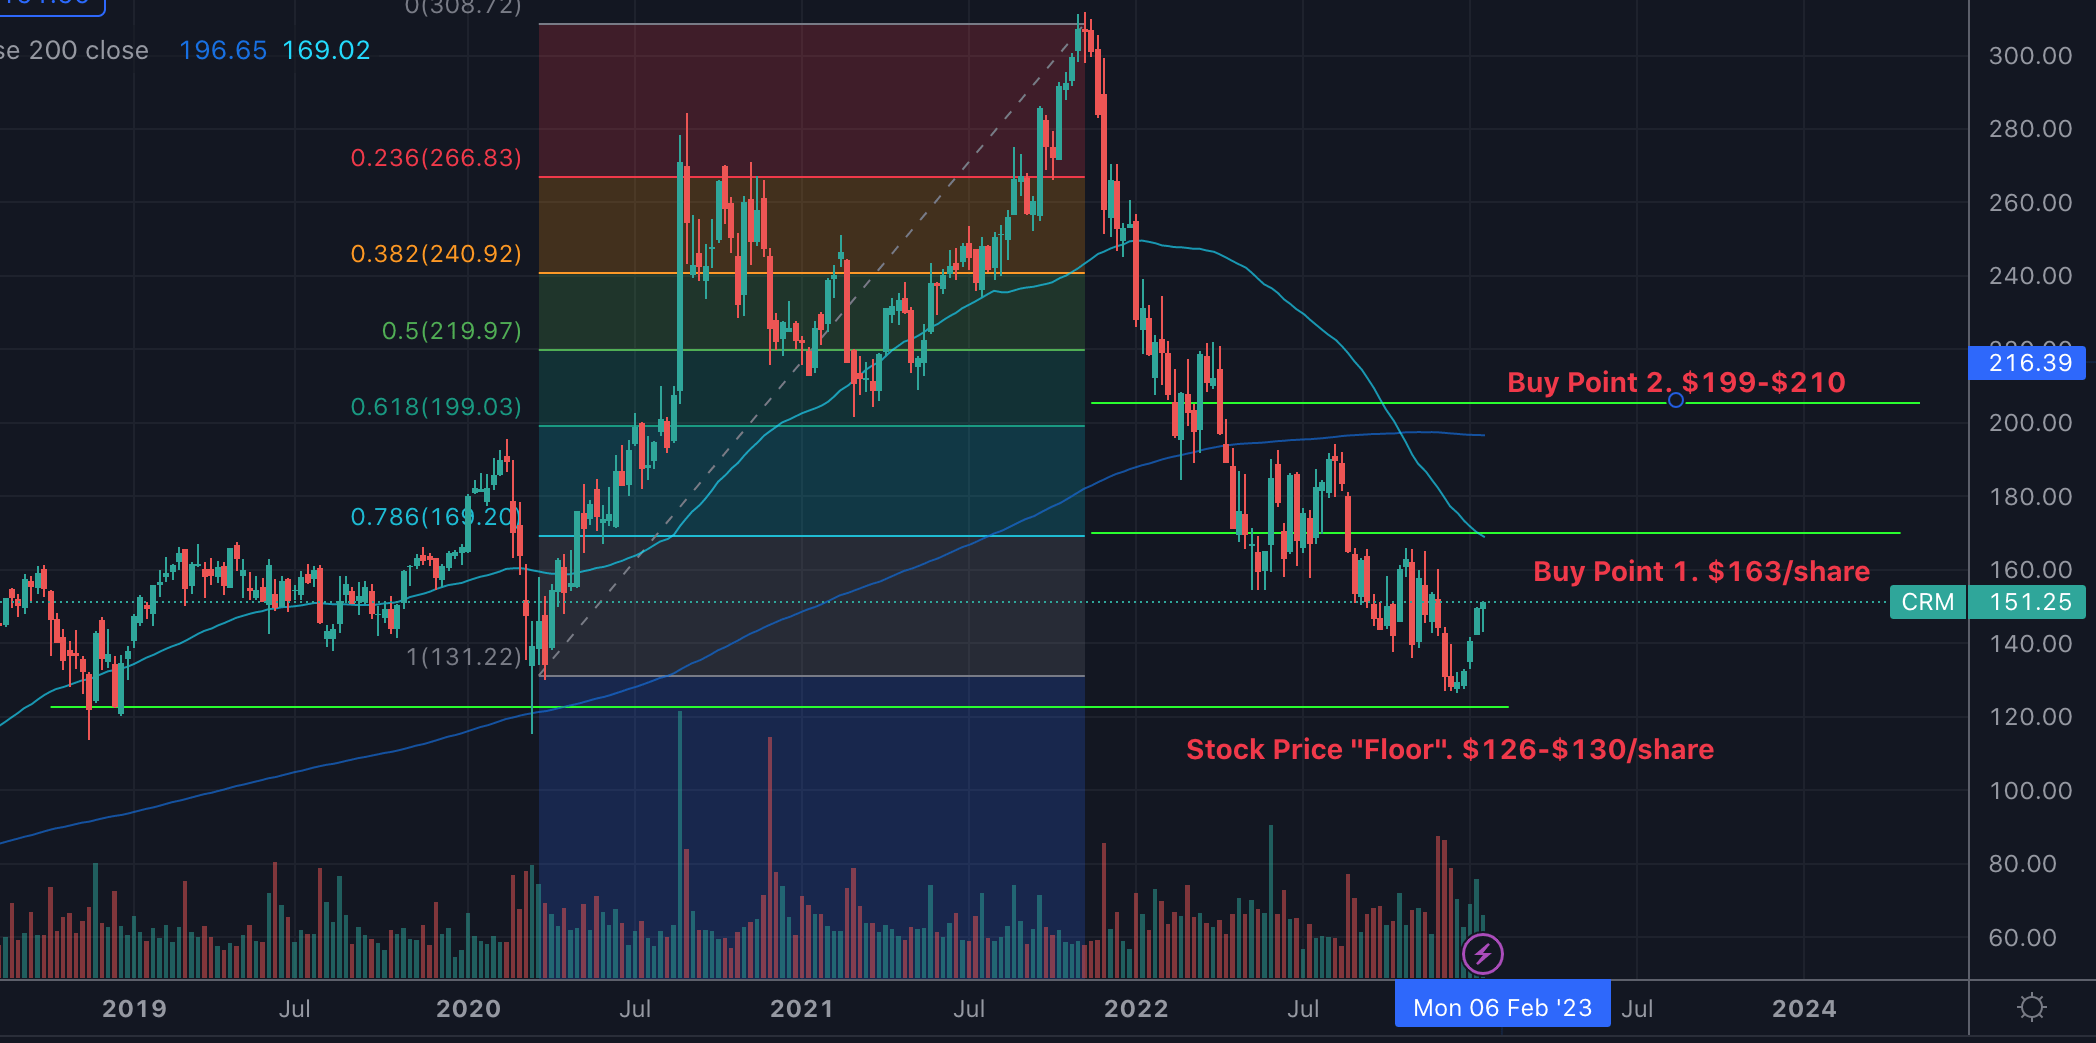
Moving up the right side of the above chart, we have “Buy Point 1” at $163/share. The stock price is showing bullish momentum (Green candlesticks), and if it can “breakthrough” the $163/share, it will likely blast much higher till at least the $199-$210 range. This represents approximately a 31% upside. However, a breakout isn’t guaranteed and will likely require a positive catalyst. This could include a positive earnings report (March 7th, 2023) or other positive news on a macro level such as the continued fall in inflation. Without a catalyst, the stock will likely bounce off the $163/share buy point. For extra information (you may have to zoom in a little), Chart 2 shows a “falling wedge” pattern and a “butterfly” at the bottom, which indicates positive momentum.
Salesforce Technical Chart 2 (Trading LauraLea)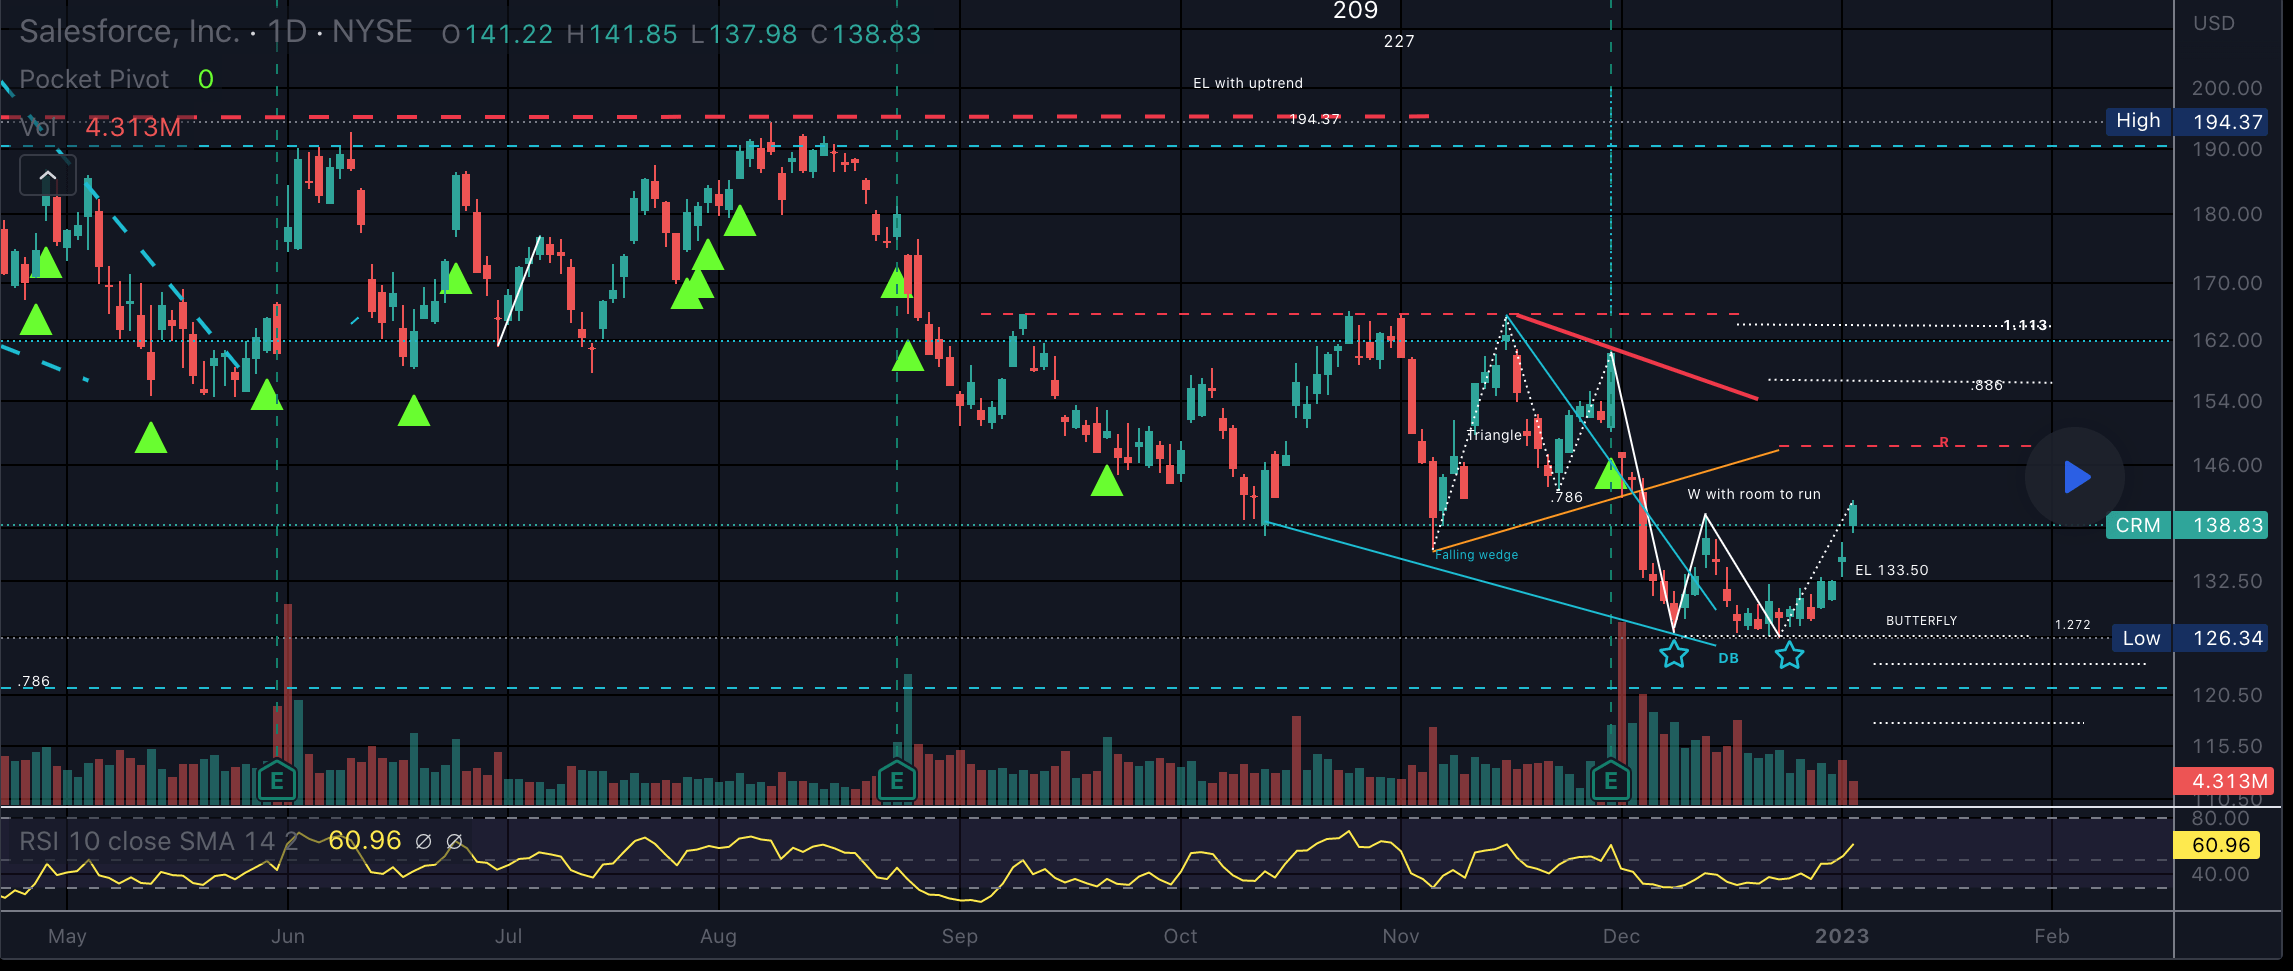
Finally, for further clarity, I have added an extra more advanced chart. This includes what is called UDIO Bars or “Up-Down-Inside-Outside Bars. This also indicates positive bullish momentum.
Technical Chart 3 (Trading IvanLabrie)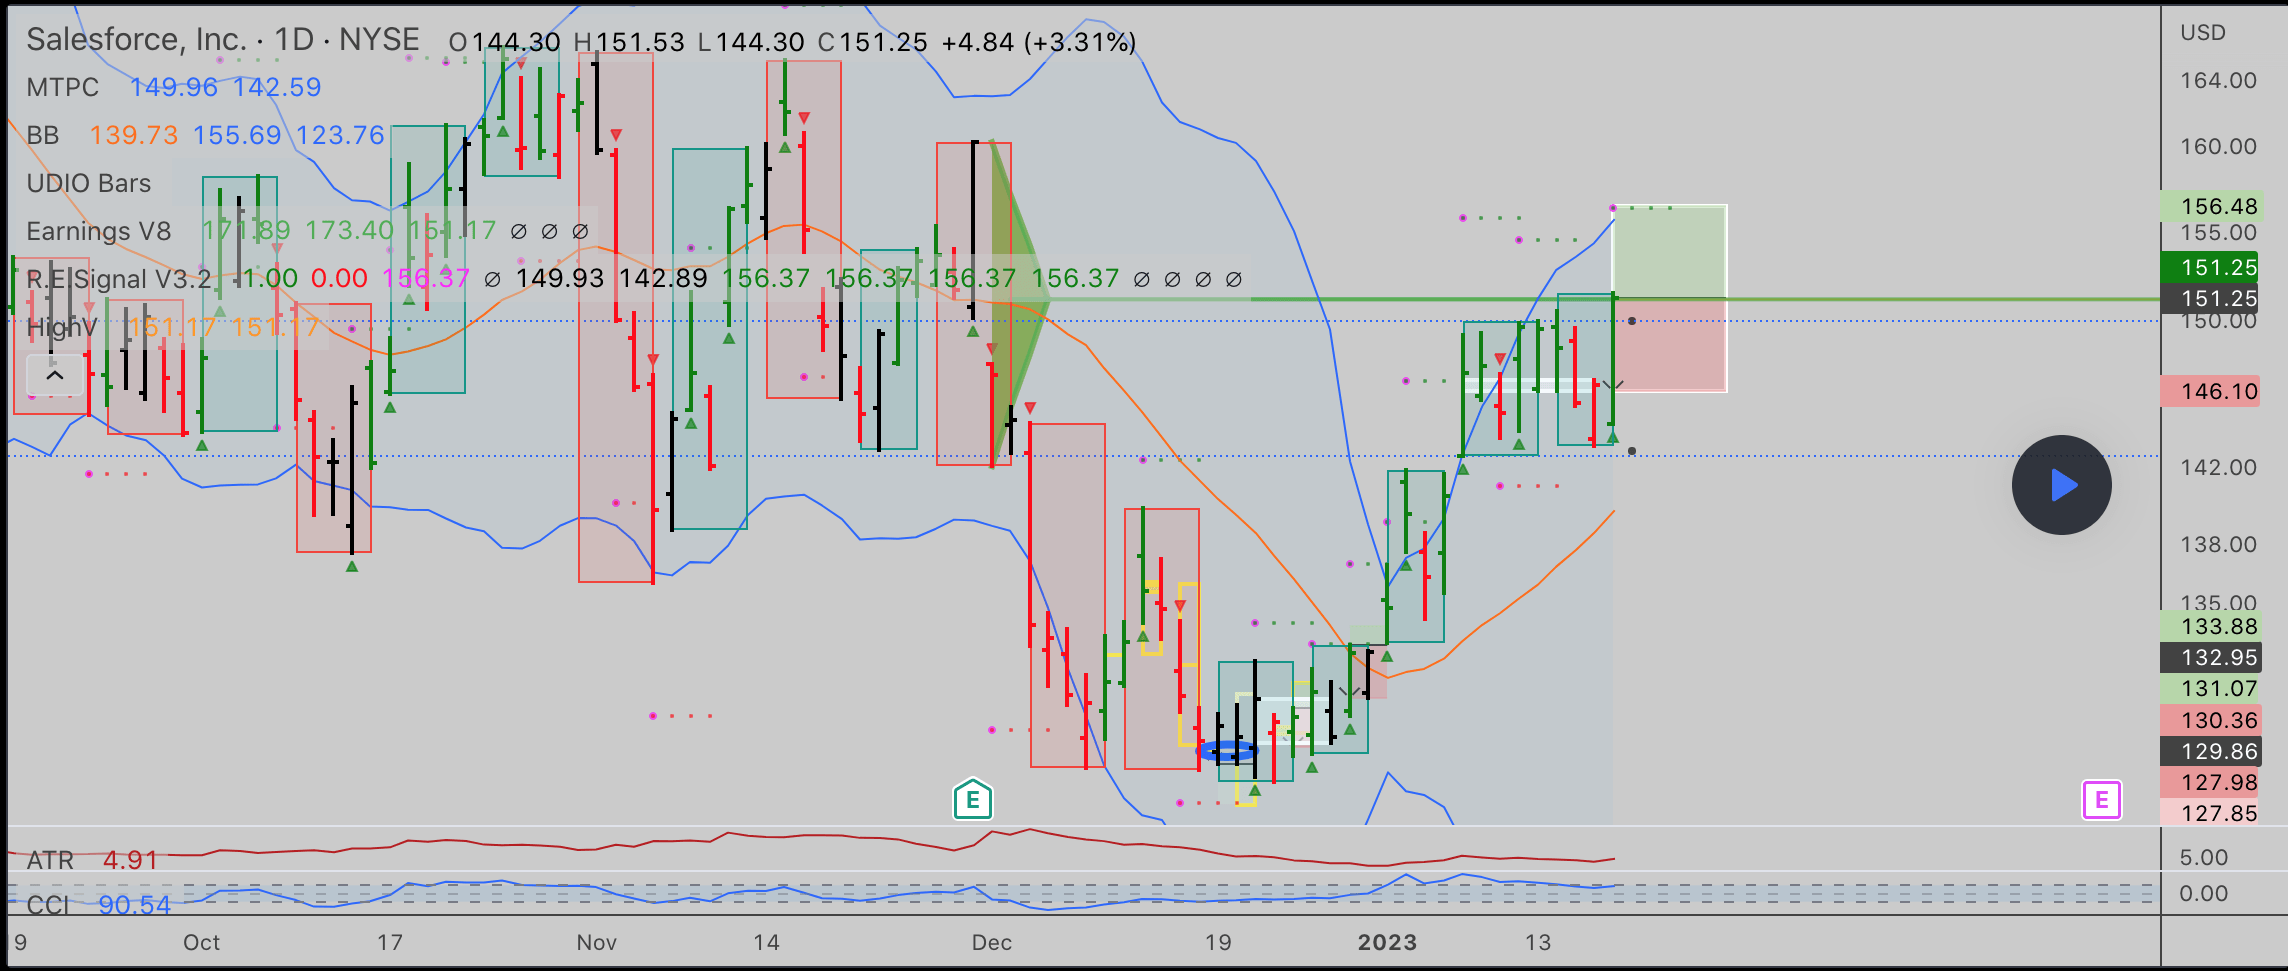
Advanced Valuation Model
In order to value Salesforce I have plugged in its financial data and updated my estimates from previous models to reflect the changing macroeconomic environment. I have forecast 15% revenue growth for “next year”, which in my model is basically Q4 of the calendar year 2022 and “this year” 2023. This is aligned with the prior growth rate of 14% achieved in the third quarter. This is a fairly conservative estimate, based on continued foreign exchange rate headwinds. In years 2 to 5, I have forecast the growth rate for Salesforce to improve to 17% per year. I am basing this upon, the historic cyclicality of the economy. Historic data shows “bad times” are followed by “good times” and given inflation is on a falling trend, I expect the Fed to lower interest rates by 2024 onwards. This will then lower the discount rate on stock valuations and thus increase the valuation multiples.
Salesforce Stock Valuation 1 (Created by Author Deep Tech Insights)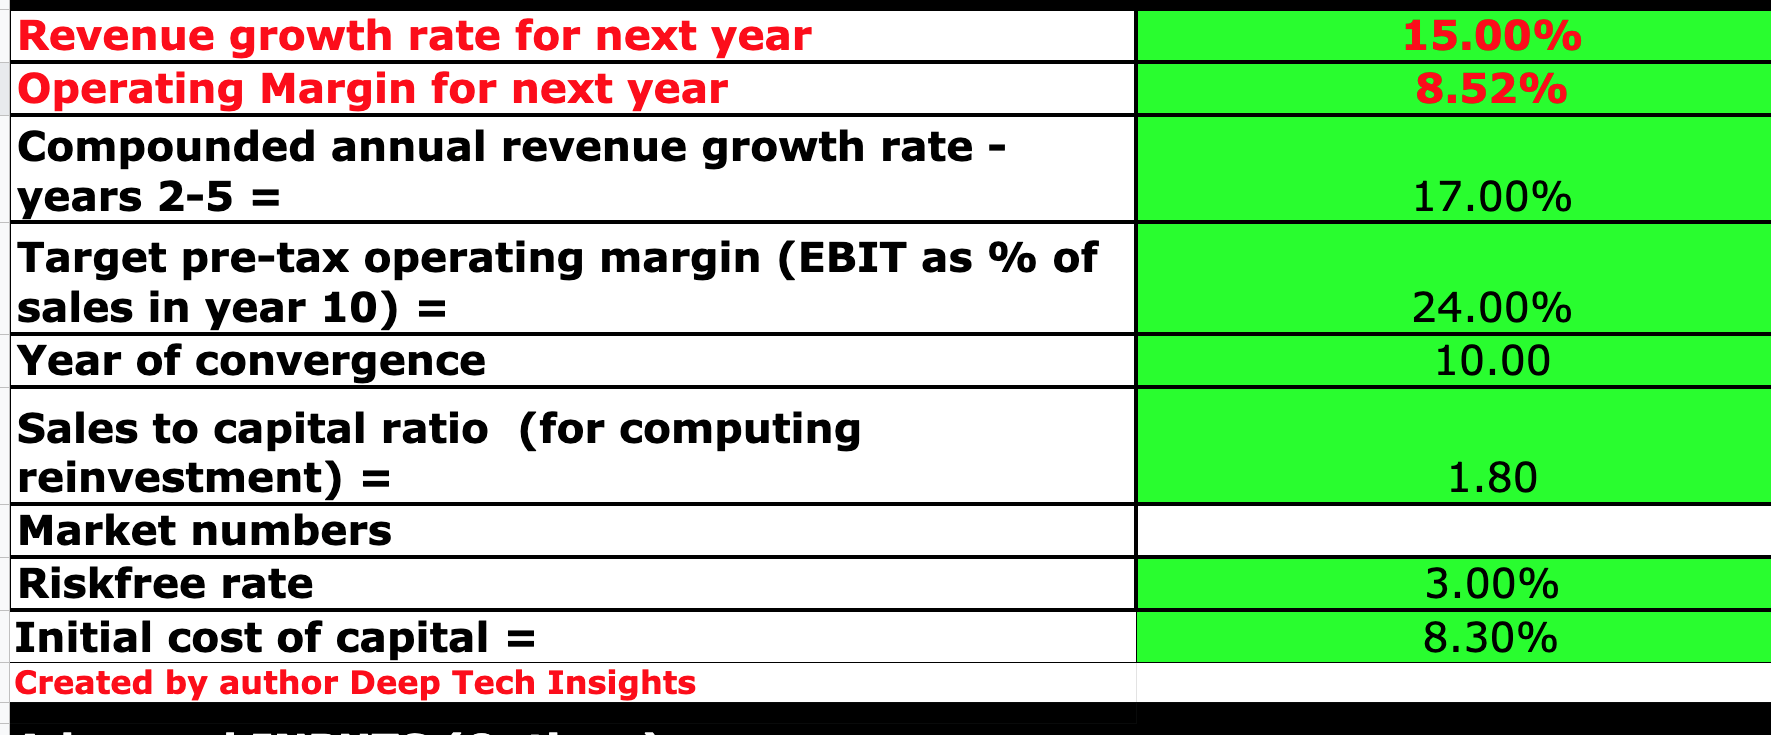
To increase the accuracy of the valuation model, I have capitalized R&D expenses, which has lifted the operating margin. As the industry average operating margin for a software company is 23% (New York University data), I have forecast Salesforce to expand its operating margin to a slightly higher 24% over the next 10 years. As I believe, Salesforce is an “above average” software company with an elite of “sticky” customers which includes nearly all of the Fortune 1000.
Salesforce Stock Valuation 2 (Created by Author Deep Tech Insights)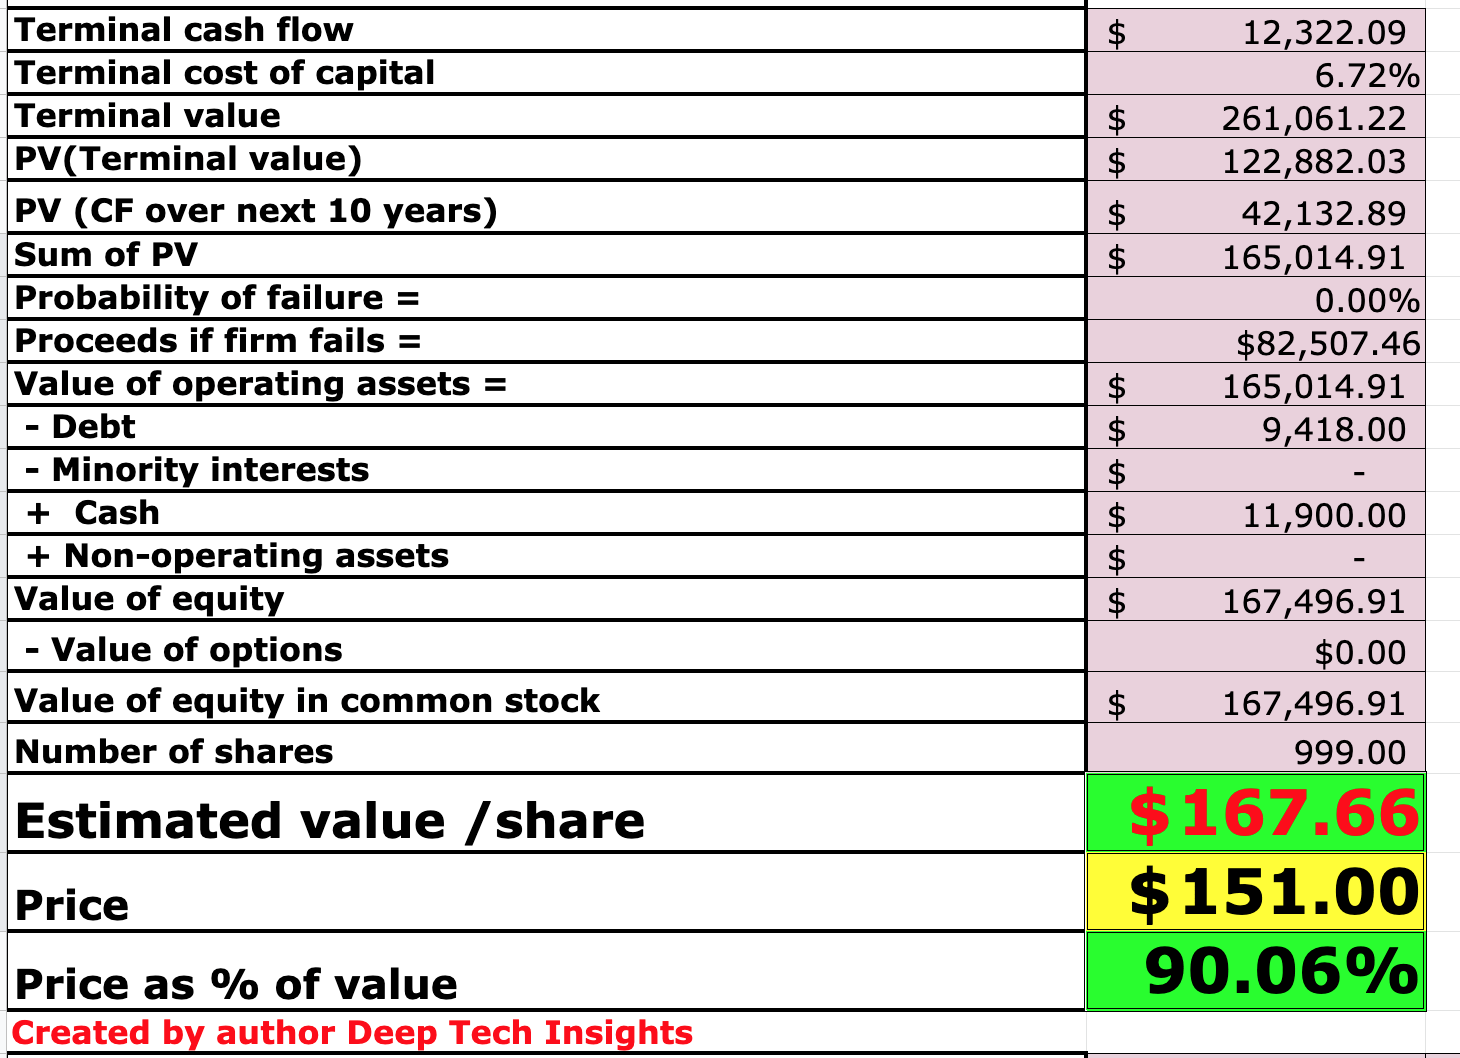
Given these factors I get a fair value of $167/share, the stock is trading at ~$151/share and thus is ~10% undervalued.
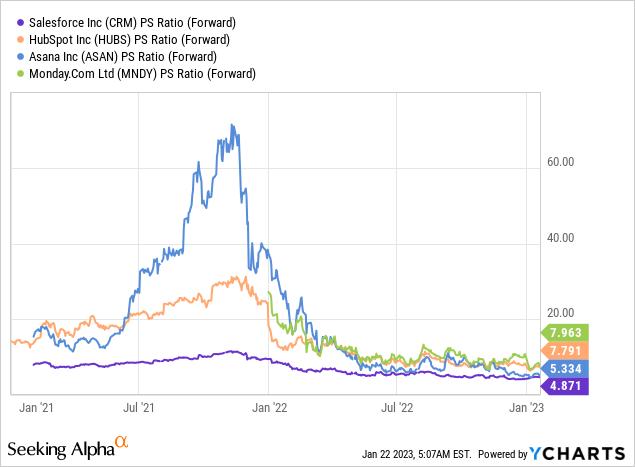
As extra datapoints, Salesforce trades at a Non-GAAP Price to Earnings (P/E) ratio = 30, which is 44% cheaper than its 5-year average. The stock also trades at a price-to-sales ratio = 4.8, which is 38% cheaper than its 5-year average. Relative to other software companies, Salesforce trades at one of the cheapest valuations (chart below, purple line). HubSpot (HUBS) offers a similar product range but is more targeted toward small, medium-sized businesses and startups. HubSpot trades at a higher price-to-sales ratio = 7.79.
Risks
Recession/Longer Buying cycles
As mentioned prior, many analysts have forecast a recession for 2023. Therefore, I would expect longer buying cycles and delayed spending by organizations. This will likely result in continual slow growth for Salesforce and make its extra products harder to upsell. In addition, with the Russia-Ukraine war still waging on, I imagine the Euro will stay devalued relative to the U.S. dollar for at least the next year.
Final Thoughts
Salesforce offers the “gold” standard in CRM and sales automation software. The company has continued to grow via acquisition and produce solid financial results, beating analyst expectations. Despite a tough economic backdrop, its technical chart is looking strong and fast approaching a “breakout”. In addition, its stock is undervalued intrinsically and relative to historic multiples. Therefore, Salesforce is likely a great long-term investment.
Disclosure: I/we have no stock, option or similar derivative position in any of the companies mentioned, and no plans to initiate any such positions within the next 72 hours. I wrote this article myself, and it expresses my own opinions. I am not receiving compensation for it (other than from Seeking Alpha). I have no business relationship with any company whose stock is mentioned in this article.