
Summary:
- Tesla’s stock has followed a predicted downward trend, consolidating around its current price level.
- The imposition of tariffs on imported Chinese EVs by the Biden Administration may impact the U.S. market.
- Two potential scenarios for Tesla’s stock include sideways movement or a short-term rise followed by a decline, both suggesting limited long-oriented investment opportunities.
- In this technical article, I discuss important price levels and metrics that investors could consider for gaining an edge on the stock’s likely price action.
Oleksii Liskonih
Tesla, Inc. (NASDAQ:TSLA) stock has followed very closely my assumption of a breakdown towards its major support, and since then, the stock has reacted positively until it consolidates around the actual price level. While the formed range can offer profitable swing trades for short-term traders, the stock still doesn’t offer a positive risk-reward profile for entering significant long positions.
In this article, I confirm my sell rating on Tesla stock and support my thesis through two scenarios, where both lead to lower prices, despite one scenario offering short-term potential gains if the stock breaks out from its resistance and tests the overhead limit of the trend channel.
A Macro Perspective
After global commerce saw economies opening and tariffs reduced over the past half-century, in the past few years, some countries have tended to turn to a more protectionist strategy, with emerging economies such as Indonesia imposing substantial entry barriers to its market or defending its natural resources from being exported before being processed; while also the U.S. has adopted a more restrictive policy in the past few years, especially against China.
Historically, imposing tariffs hasn’t always led to the desired economic outcome; in 1930, the Smoot-Hawley Tariff Act was meant to alleviate the adverse effects of the Great Depression and defend U.S. jobs by imposing tariffs on imported goods. Instead, the U.S. trade partners raised tariffs on their side, which led to a freezing in international trade and sunk the U.S. economy more profoundly into the Great Depression. In 2002, President George W. Bush imposed up to 30% tariffs on steel imports to protect domestic producers and secure jobs. The result was increased price pressure on steel-using industries, such as the automotive industry, production delays, increased inflationary pressure for the U.S. consumer, and finally, over 200’000 jobs were lost to higher steel prices. The tariffs were then abandoned after many trade partners, including the EU and Japan, challenged the imposition at the World Trade Organization, which ruled the tariffs as illegal.
Ten years later, the Obama Administration imposed 30% or more tariffs on Chinese solar panel manufacturers to avoid price dumping in the U.S. market. While the tariffs have phased out most of the direct imports, the U.S. has failed to build its solar panel industry and is highly dependent on imports from Southeast Asian companies, such as Vietnam, Malaysia, Cambodia, and Thailand. At the same time, many of these manufacturers are connected to China or even supported by the Chinese government.
On May 14th, 2024, the Biden Administration announced a 100% border tariff on imported Chinese Electric Vehicles (EVs), up from previously 25%, among other tariffs targeting solar panels, aluminum, advanced batteries, and medical equipment, aiming at protecting U.S. jobs and avoiding price dumping.
While some tariffs are phased out over the coming three years, those targeting the import of EVs take effect in 2024, as Chinese EV manufacturers are seen flooding the U.S. market with electric cars starting at prices as little as $12,000 in the domestic market. While these cars would undoubtedly have to be adapted for the U.S. or the European safety standards, adding on the consumer price, on top of the transportation cost, manufacturers such as BYD Company Limited (OTCPK:BYDDF, OTCPK:BYDDY) benefit from subvention by the Chinese government allowing them to compete on an international level with a low cost-basis.
Although only a few cars made in China are sold in the U.S., the tariffs are here to avoid what happens instead in the EU, which is expected to address the steep increase in imported Chinese-manufactured EVs by imposing tariffs despite the fear of a backslash by the Chinese government. The import to the EU of Chinese-manufactured EVs rose by 112% in the first seven months of 2023 and even by 361% since 2021, and Chinese brands are projected to expand their market share significantly in the coming years.
Deutsche Welle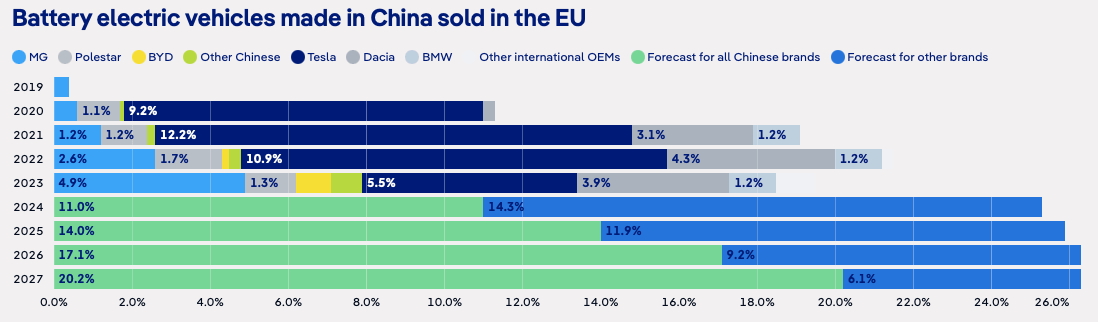
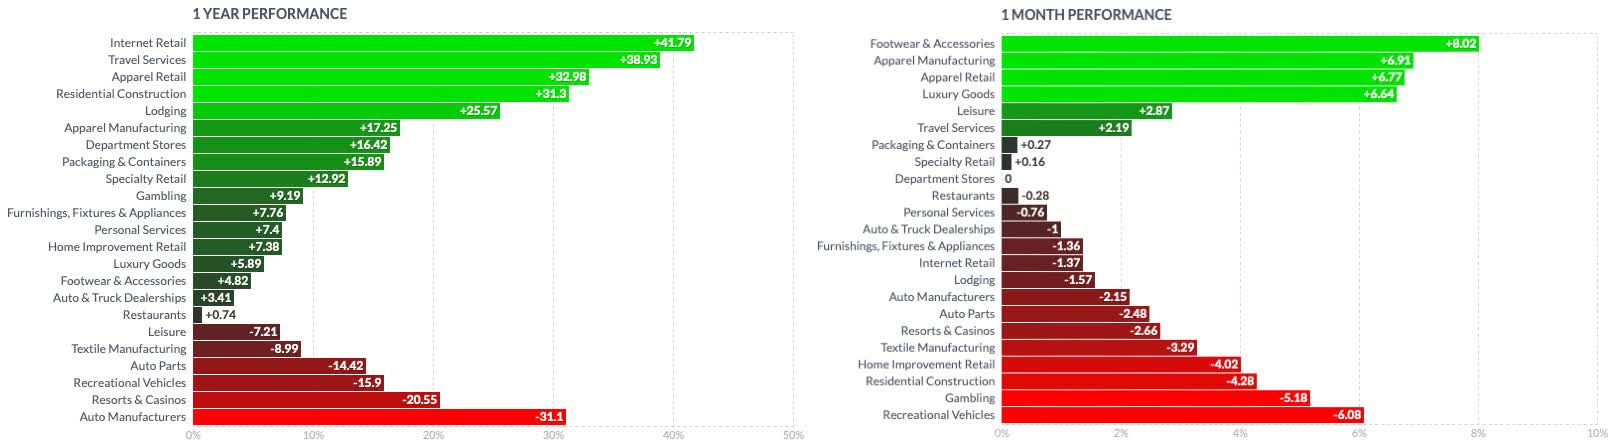
At this point, it is not clear what the consequences of the tariffs will be, if these will have the expected positive impact on the US economy, or if a backslash from China could hit the economy and cause more damage than having a positive effect, like in the past. On an annual basis, the technology sector in the US continues to lead in performance, closely trailed by companies in communication services. However, the U.S. consumer cyclical sector is experiencing significantly slower growth and is hinting at more slowdown in the previous month, with auto manufacturers trailing yearly and continuing to be among the losers on a shorter perspective.
finviz finviz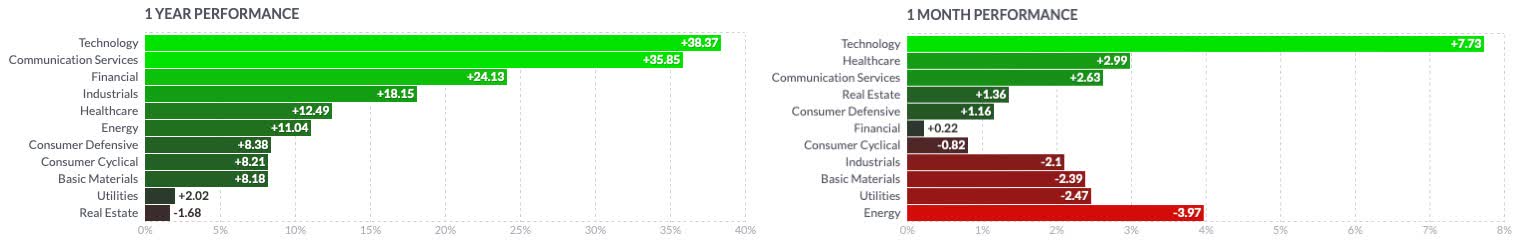
The Global X Autonomous & Electric Vehicles ETF (DRIV) continues to be supported by its short-term exponential moving averages (EMA) while failing to break under its long-term EMA consistently. The industry benchmark is trapped in its range between $20 to $25 with a slight positive tendency, which might lead to a breakout attempt, but according to the moving average convergence divergence (MACD) indicator, this isn’t expected anytime soon, and DRIV is performing negatively when compared to the broader stock market represented by the iShares Russell 2000 ETF (IWM).
Author, using TradingView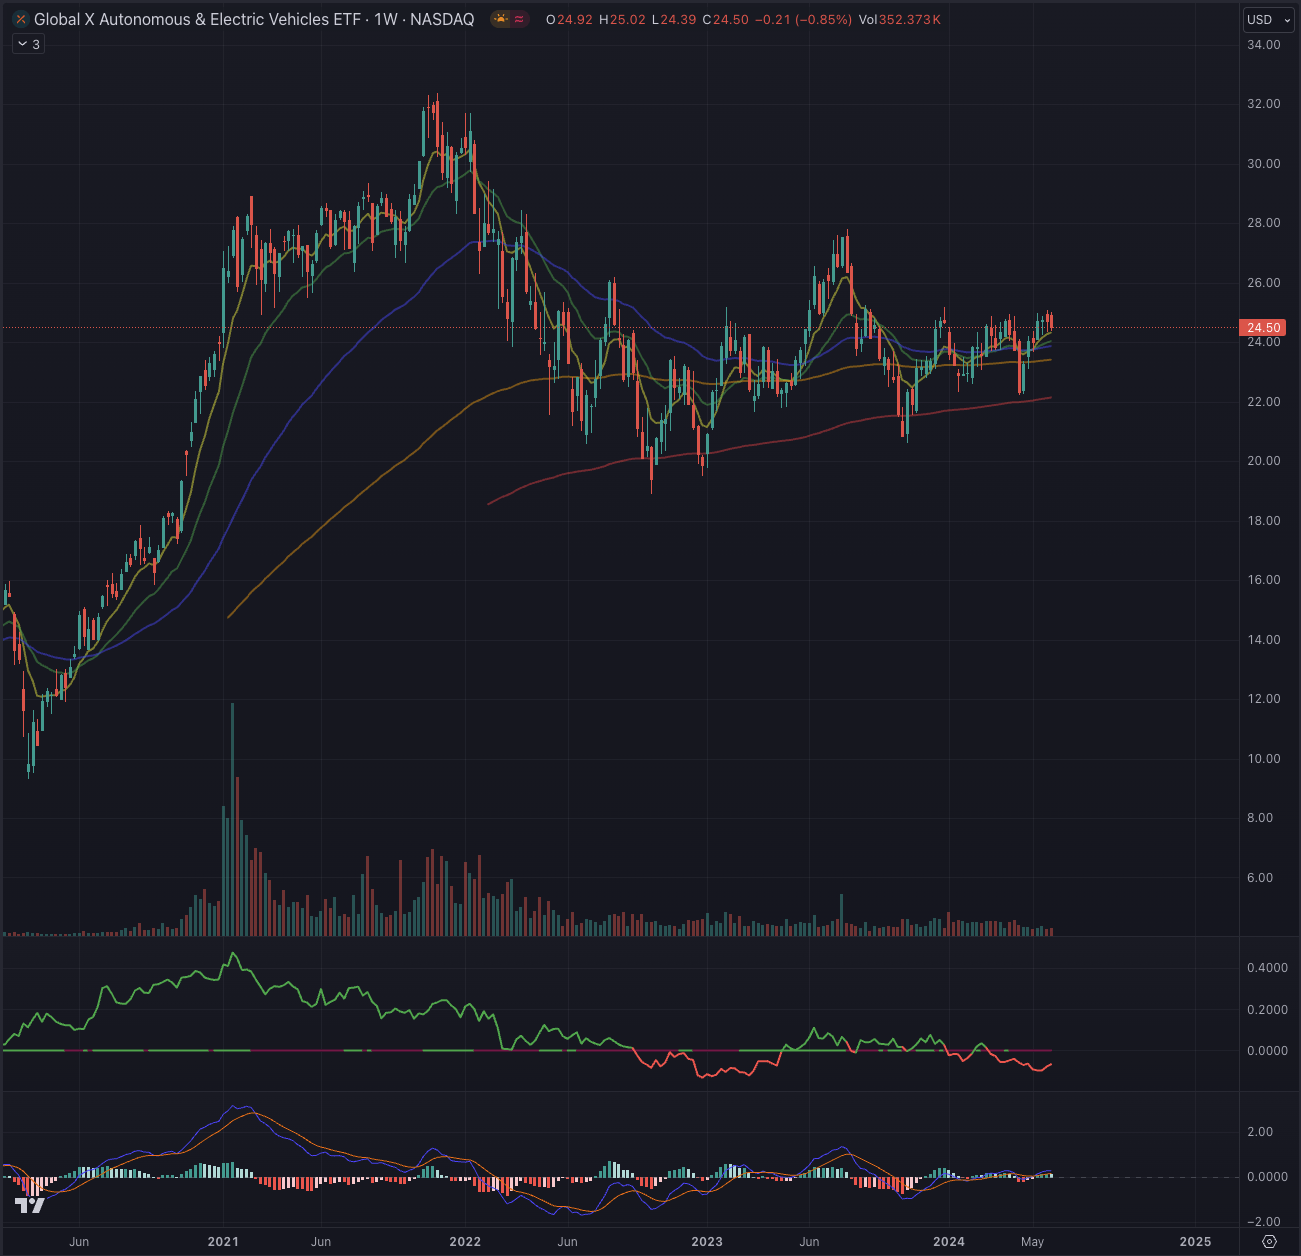
Where Are We Now?
In my article “Tesla’s Decline: Unveiling Growing Downside Risk” published on February 14, 2024, I confirmed my sell rating on TSLA, describing the scenario I saw as most likely leading to a significant drop.
TSLA would fill the gap and retrace towards its support level at $175. Upon its second attempt, it could break down further and reach a vital liquidity pool left between $152.37 and $146.41, closing the open gap in that area. This price range would align with the trendline traced from the pandemic low.
Author, using TradingView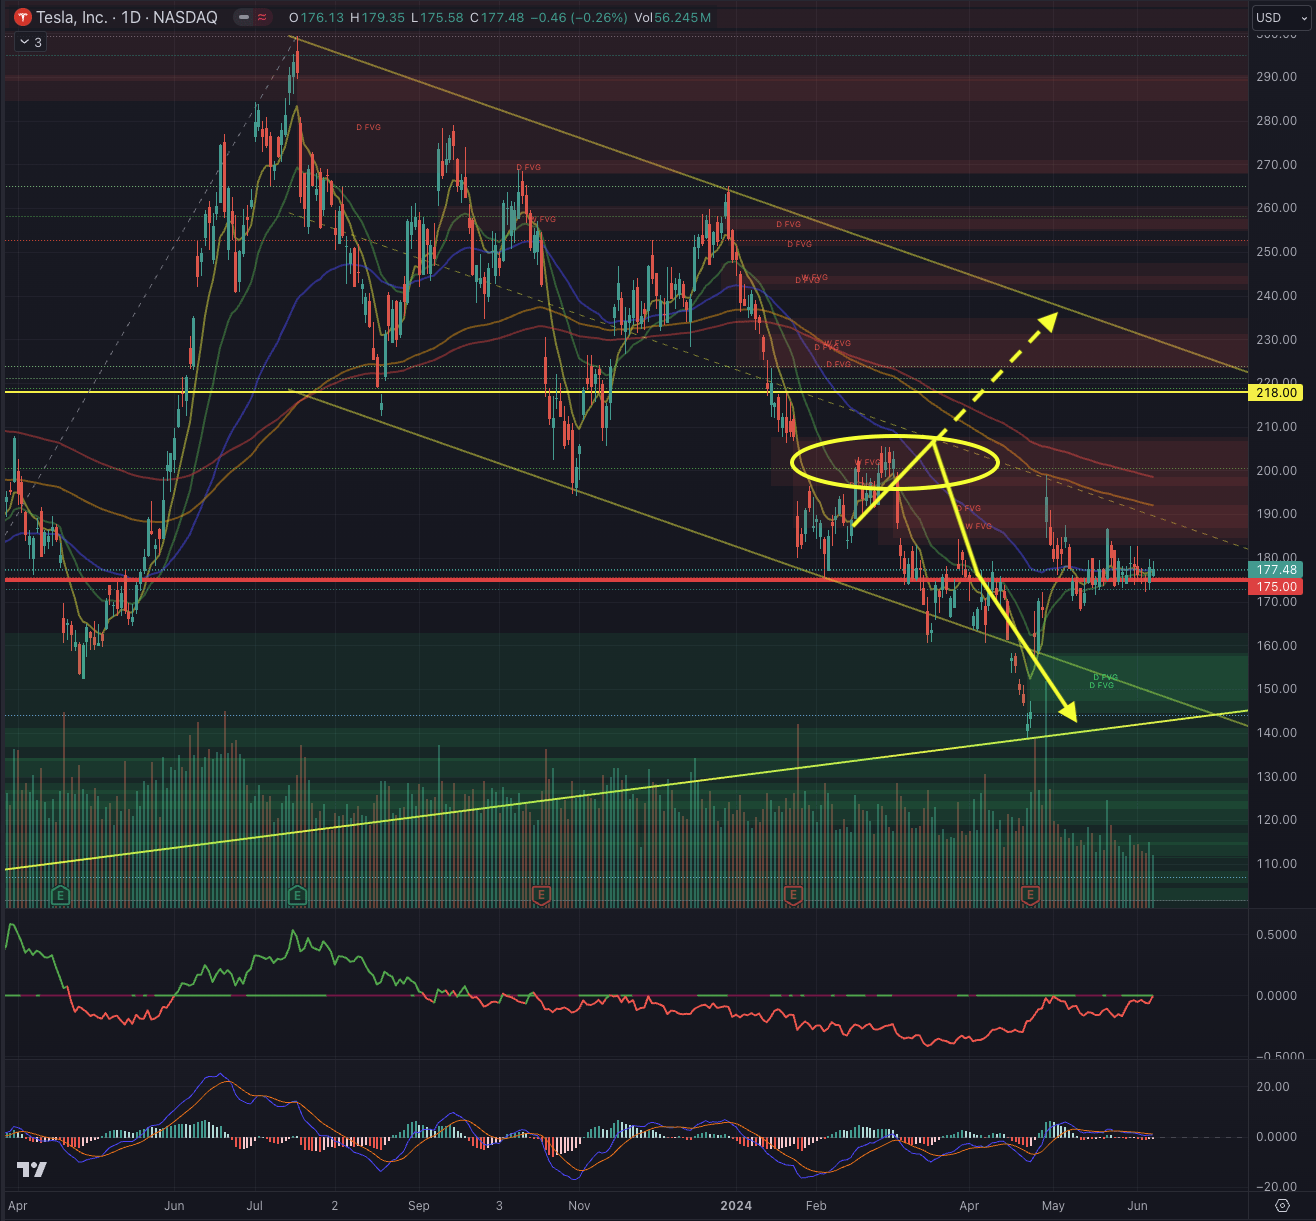
The stock has indeed traced a very similar trajectory, as assumed in my scenario, by filling the overhead gap before heading to testing the support, finally breaking under it, until testing the strong support at the ascending trend line.
Author, using TradingView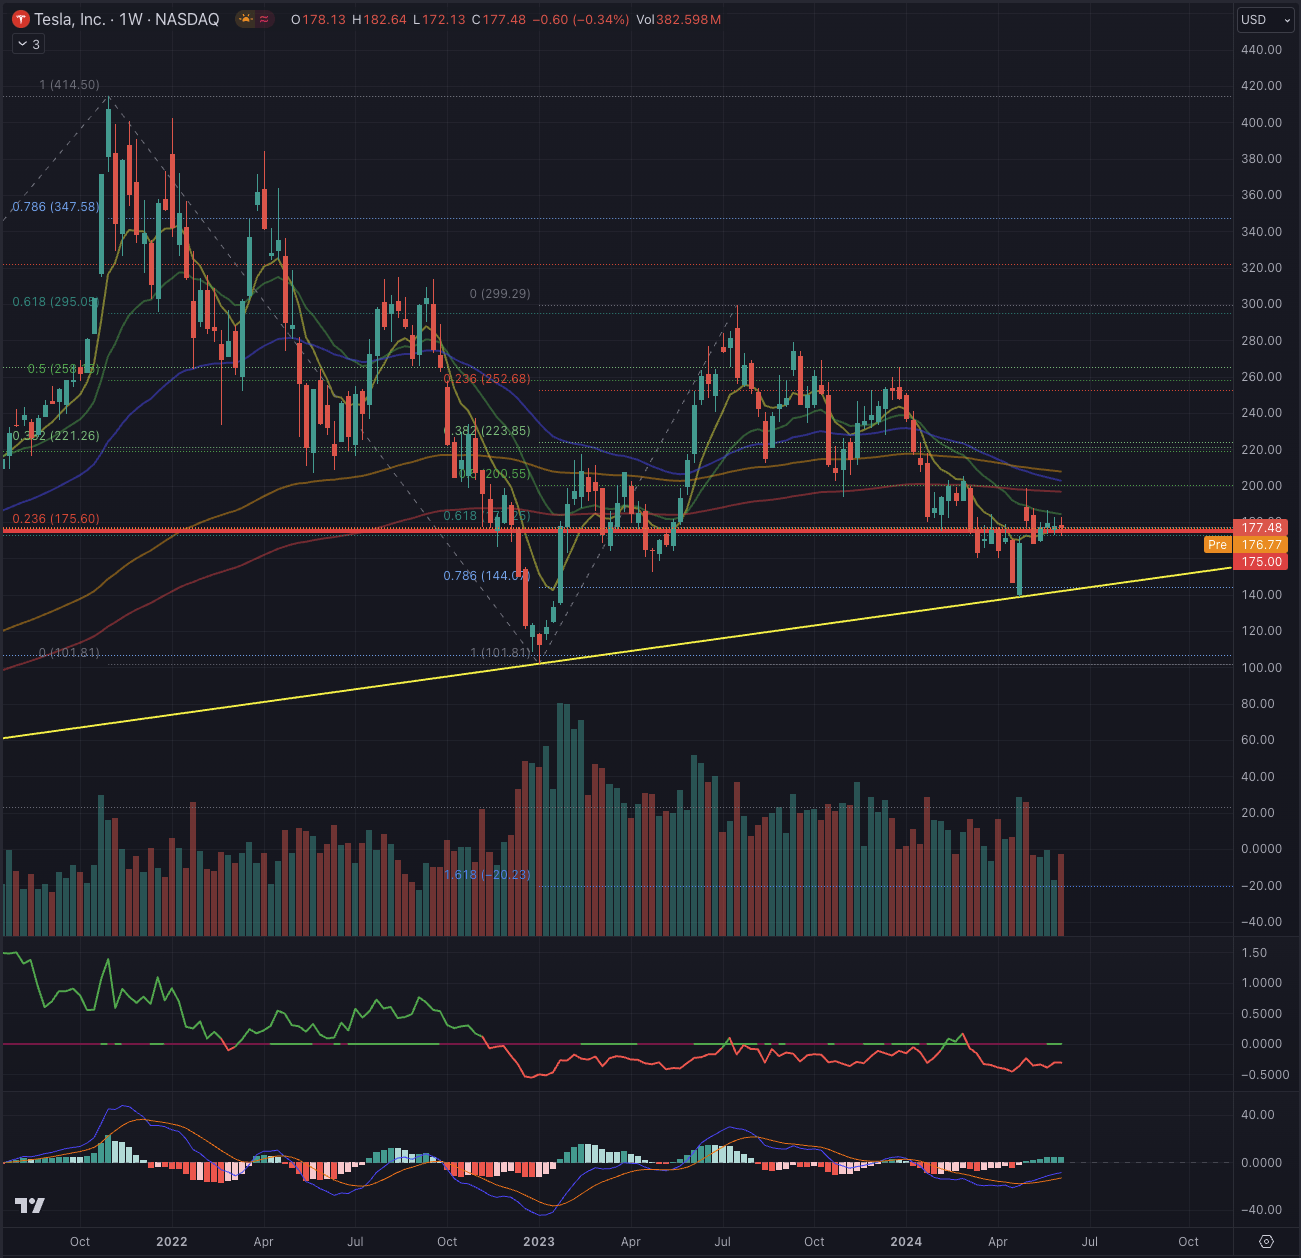
A strong positive reaction from the ascending trend line was expected, leading TSLA to test its EMA200 on its weekly chart. The stock got rejected on its long-term EMA and is now hovering around the previous support area, marked by the 61.8% Fibonacci retracement of the prior peak. While the positive crossing of the MACD could signal a change in the trend, TSLA is still performing worse than the technology index, represented by the Nasdaq Composite (COMP.IND).
What Is Coming Next?
TSLA’s recent price action has again resulted in a significant open gap, ranging from $147.26 to $157.51.
Author, using TradingView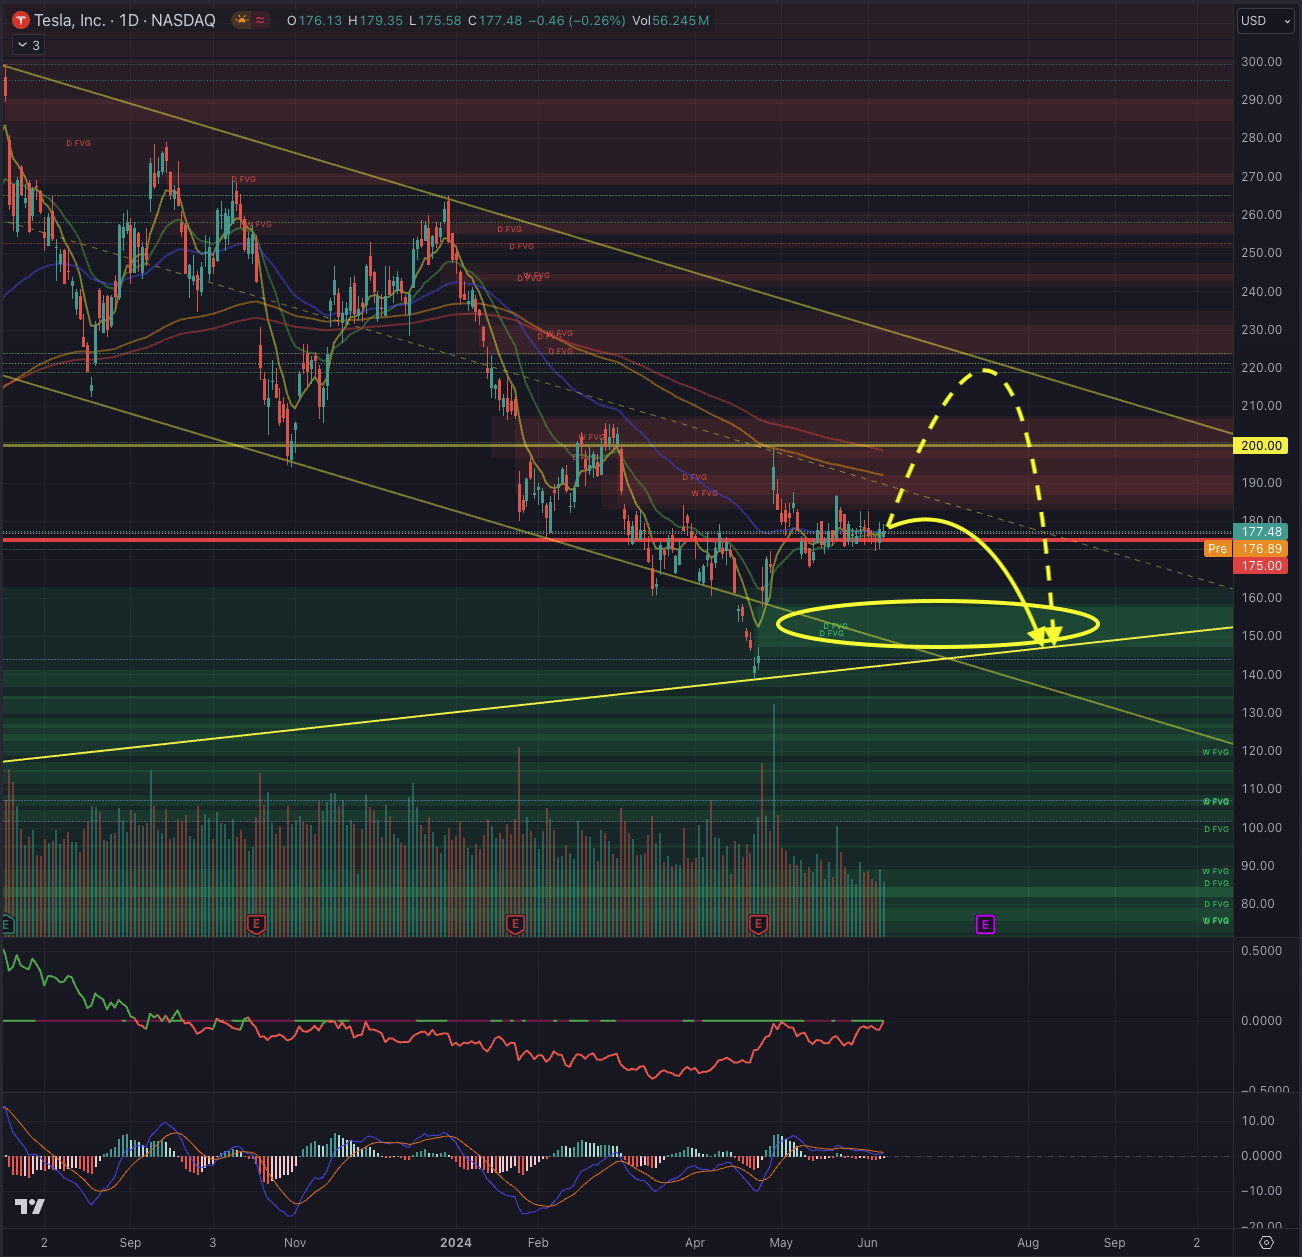
In the first scenario, I estimate TSLA to be performing sideways until dropping towards the trend line while filling the open gap. This price action would lead the stock around $146, from where a stronger movement would be anticipated, aligned with the Q2 results release expected on July 17th.
The second scenario, which I consider less likely, would see TSLA experiencing higher volatility toward the Q2 release. Projecting the stock above its EMA200 and testing the upper range of the descending trend channel, it would trend again lower until the gap would be filled at $146.
While the second scenario would hint at a short-term range trading opportunity, the anticipation of both scenarios ending toward the support line does not encourage building up long positions for long-term-oriented investors. The actual situation and the expected scenarios are leading me to maintain my sell rating on TSLA.
The Bottom Line
Technical analysis is not a definitive tool but a method to increase investment success and provide market direction. Like using a map or GPS for a journey, investors use technical analysis to guide decisions. I apply techniques from Elliott Wave Theory and Fibonacci principles to assess potential outcomes and probabilities. By validating specific outcomes based on these theories, I identify stock entry points after examining price action, sector, and industry dynamics. The goal of my technical analysis is to evaluate a stock comprehensively and calculate probable outcomes, enabling investors to make informed decisions and navigate the market effectively.
Tesla’s stock has followed a predicted downward trend, filling an overhead gap before testing and breaking below important support levels. It is now hovering around the 61.8% Fibonacci retracement from its previous peak, consolidating around its short-term EMAs. Despite a positive MACD signal, TSLA is underperforming compared to the border technology market. Two potential scenarios are foreseen: a sideways movement before dropping to around $146 or a short-term rise above the EMA200 followed by a decline to fill the gap at $146. Both scenarios suggest limited long-oriented investment opportunities, while the anticipation in both scenarios of a support level test leads to maintaining a sell rating on Tesla, Inc. stock.
Editor’s Note: This article discusses one or more securities that do not trade on a major U.S. exchange. Please be aware of the risks associated with these stocks.
Analyst’s Disclosure: I/we have no stock, option or similar derivative position in any of the companies mentioned, and no plans to initiate any such positions within the next 72 hours. I wrote this article myself, and it expresses my own opinions. I am not receiving compensation for it (other than from Seeking Alpha). I have no business relationship with any company whose stock is mentioned in this article.
All of my articles are a matter of opinion and must be treated as such. All opinions and estimates reflect my best judgment on selected aspects of a potential investment in securities of the mentioned company or underlying, as of the publication date. Any opinions or estimates are subject to change without notice, and I am under no circumstance obliged to update or correct any information presented in my analyses. I am not acting in an investment adviser capacity, and this article is not financial advice. This article contains independent commentary to be used for informational and educational purposes only. I invite every investor to do their research and due diligence before making an independent investment decision based on their particular investment objectives, financial situation, and risk tolerance. I take no responsibility for your investment decisions but wish you great success.
Seeking Alpha’s Disclosure: Past performance is no guarantee of future results. No recommendation or advice is being given as to whether any investment is suitable for a particular investor. Any views or opinions expressed above may not reflect those of Seeking Alpha as a whole. Seeking Alpha is not a licensed securities dealer, broker or US investment adviser or investment bank. Our analysts are third party authors that include both professional investors and individual investors who may not be licensed or certified by any institute or regulatory body.