Summary:
- Today I see a fairly high risk of profit-taking in Tesla, Inc. stock and a further downward movement shortly.
- This is supported by both the general market indicators and the idiosyncratic technical signs in Tesla’s price action.
- The company’s market cap now is much higher than its fair value, despite the doubling of my discounted cash flow analysis price output.
- I believe that in 2023, investors will have even better chances to buy Tesla stock for a lot cheaper.
jetcityimage
My Coverage History
You are now reading my 6th article on Tesla, Inc. (NASDAQ:TSLA). I initiated coverage of TSLA on October 18, 2021, with a buy recommendation. At that time, the company’s outlook seemed rosy and some fundamental tailwinds could support the continuation of the stock rally. Exactly 2 weeks and 3 days after that call, TSLA surged more than 46% and marked its all-time high, which was never reached again.
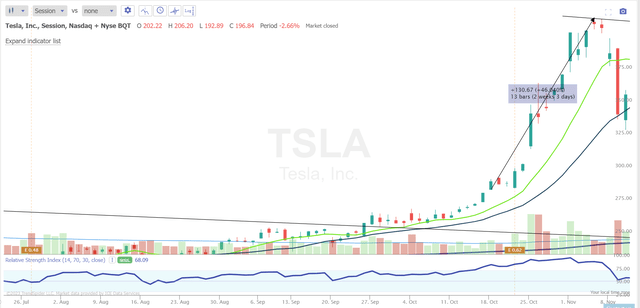
TrendSpider, author’s notes
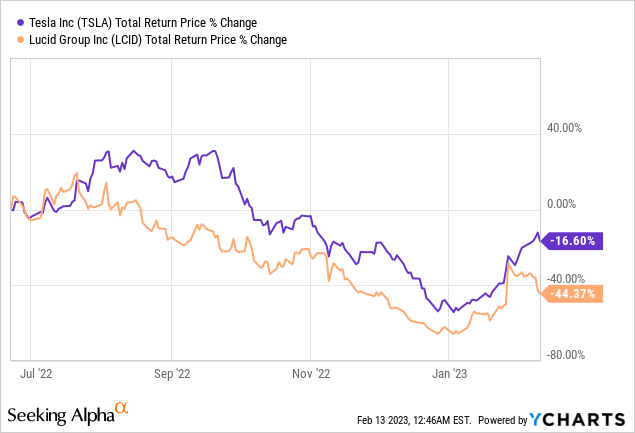
In mid-June 2022, I proposed a pair trade idea – a long position in Tesla and a short position in Lucid Group, Inc. (LCID) for the same dollar amount. I reasoned that the most robust company would continue to outperform the fast-growing niche of the auto market. In contrast, the most overvalued company in the group would continue to experience strong multiple contraction and fall much deeper. Since then, the spread between the two stocks has been comfortable enough to make money even after factoring in the commission on the short position and the sharp drop in TSLA in December 2022:
On October 21, I was Neutral, saying Tesla stock was overvalued and warning about the risks in the company’s accounting – this call coincided with the start of “the great meltdown.”
At the end of December, I caught the news that Elon Musk had stopped selling his stock and would not sell for 1-2 more years – at least that’s what he announced publicly. Few people wrote about it at the time, but as it turned out later, my guess about reducing supply in the market had a positive effect on the price action.
In the last article – “Tesla Stock: Go Fishing Below $100” – I wrote the following:
No one knows exactly when the downward slide of Tesla stock will end. However, one thing seems clear to me – TSLA’s 43% drop in just 2 last months looks like a textbook stock market overreaction against a backdrop of plenty of negative news and a lack of positive news for the company.
[emphasis added by the author]
Then I expected TSLA to fall even lower – that’s when I suggested taking a position in the portfolio. I was wrong – after my call, the stock has not fallen below $116 and has gained >80% in 2 weeks and 2 days.
My Updated Thesis Today
Today I see a fairly high risk of profit-taking and a further downward movement shortly. This is supported by both the general market indicators and the idiosyncratic technical signs in TSLA’s price action. All of this is coupled with a strong gap between the company’s market capitalization and its fair value [I update my discounted cash flow, or DCF, model upward in today’s article, but that does not solve the overvaluation problem]. I am Neutral on the stock again, but this time more bearish in the short term than before.
Profit-Taking Is Around The Corner
In recent weeks – and indeed since late December, when the market (SP500) refused to go lower after bouncing off its 200-day moving average – we have seen strong advances in sentiment. The extreme fear of mid-October 2022 has turned into extreme greed by early February 2023, and we are still in an environment of heightened greed, according to CNN’s Fear & Greed Index:
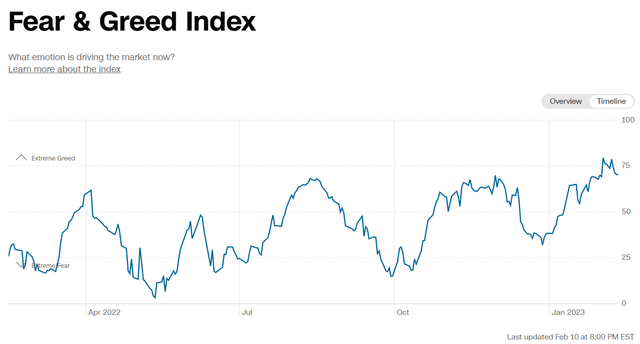
CNN Business
It may seem to you in recent days that everyone is expecting another correction from current levels – but that is not the case! The consensus view, if you break down the above index into its component parts, is that the market should continue to rise shortly after the upcoming publication of the February CPI figures.
The McClellan Volume Summation Index – the volume of shares on the NYSE that are rising compared to the number of shares that are going down – peaked on Feb. 2 and is still at a very high level, which means the market still has a lot more buyers than sellers.
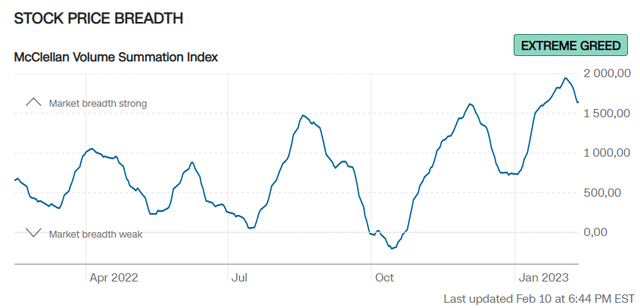
CNN Business
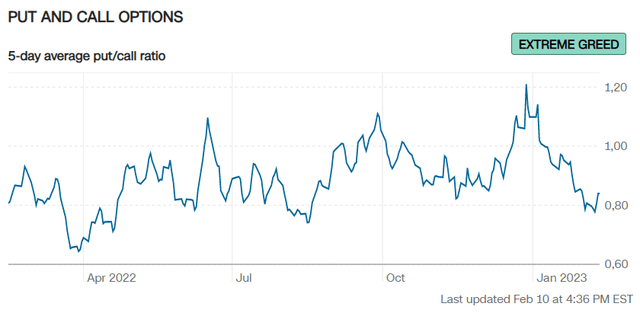
The previous highs of this indicator – April 4, August 18, and December 3, 2022 – coincided with the local highs of the S&P 500 Index (SPY). The 5-day average of the put/call ratio behaved inversely proportional, which now also indicates an extremely bullish view of the general market:
CNN Business
I point out these indicators in the Tesla article for two reasons.
First, TSLA is a high-beta [2.11] stock whose 30-day rolling volatility exceeds the market by almost five times [YCharts data]. Simply put, this means that the usually positive correlation between TSLA and SPX forces the former to follow the movement of the latter at double or even triple speed. Now the correlation between Tesla stock and the broader market is broken – this goes against normality and is an anomaly that usually does not last long.
The second reason is that the market rally we have seen recently appears to have been fueled by Tesla buyers. Just look at the volumes of the biggest 12 names:
![Bloomberg, shared by jeroen blokland [Twitter: @jsblokland]](https://static.seekingalpha.com/uploads/2023/2/13/49513514-16762712433448431.jpg)
Bloomberg, shared by jeroen blokland [Twitter: @jsblokland]
The trading volume of Tesla has seen a drastic change in 2023 compared to 2022. In 2022, a 20-day average trading volume between 60 to 90 million shares per day was considered normal, with volumes exceeding 90 to 100 million being considered remarkable. However, in 2023, days with trading volumes below 150 million are now considered modest.
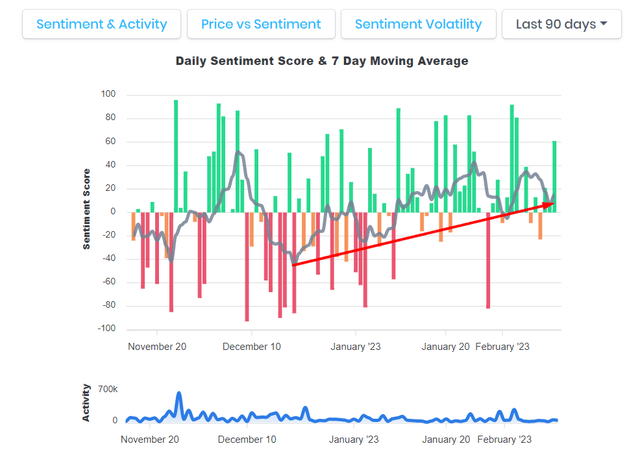
In my opinion, this is because in the last few weeks, more people wanted to buy the stock every day – the excitement was enormous when the mood of the crowd changed:
socialsentiment.io, author’s notes
I expect massive profit-taking in TSLA stock now that we are moving from greed to fear again in the market – those who came to chase the rally will most likely start closing their positions en masse, triggering an avalanche effect.
Tesla’s Technicals Are Bearish
I am not a professional technician or CMT holder – just sharing my view on technical things that I find interesting for both bulls and bears.
The influx of new buyers in recent weeks has pushed the RSI indicator higher – this indicator reached the 85 mark on the 4-hour chart in late January. Since then, however, the strength gradually began to cool down, falling to 63 by February 11. Actually, everything would be fine, but during that time [2 weeks] the stock rose by almost 20%, while the RSI fell – an RSI divergence took place, continuing to this day:
![TrendSpider, TSLA [4-hour], author's notes](https://static.seekingalpha.com/uploads/2023/2/13/49513514-16762746838071487.png)
TrendSpider, TSLA [4-hour], author’s notes
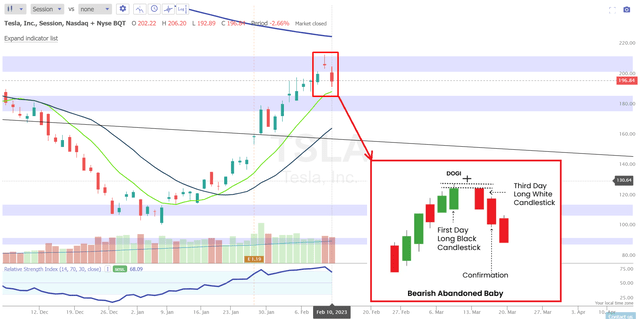
The daily chart confirms the bearish outlook for TSLA. We see that on February 9, TSLA stock failed to break through its local resistance zone – the lows of May, June, and October of 2022 – after which the price cooled down slightly (on February 10, we saw a 5% decline). The resulting candlestick pattern is known as the “Bearish abandoned baby“:
TrendSpider, TSLA (session), author’s notes
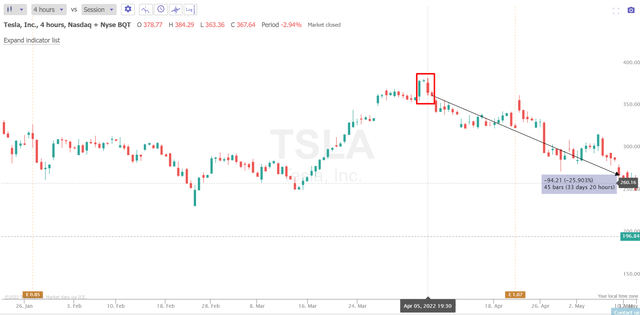
This reversal pattern was, for example, on April 5 the beginning of a new downward trend:
TrendSpider, TSLA, author’s notes
Or, for example, at the end of November 2021, when the price tried twice to overcome its local resistance but finally gave up and fell by 17% within a few days:
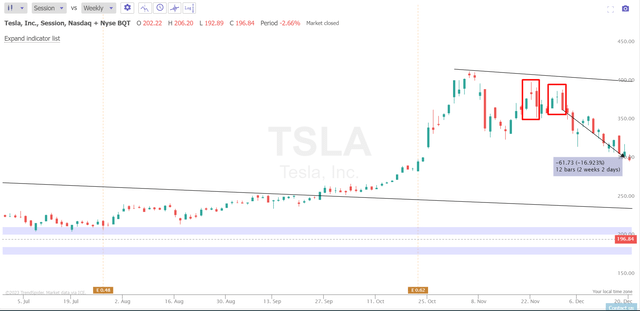
TrendSpider, TSLA, author’s notes
This is just an indirect sign that Tesla has a difficult road ahead – you cannot just rely on these patterns. However, against the backdrop of the extreme greed I mentioned earlier, the current technical picture is becoming way clearer in the short term. Clearly bearish.
Valuation, Again
Let me briefly describe the conclusions I have come to in valuing Tesla last time [Jan. 10, 2023].
I took some investment banks’ reports and the consensus and made the DCF assumptions much more conservative – from the working capital estimates to the WACC. I also tried to use an exit multiple [EV/EBITDA] for the Enterprise Value calculation instead of Gordon’s growth rate to minimize the sensitivity of the model and thus the extent to which the forecast deviates from reality. Then TSLA was valued at $98.53 per share.
As the company’s subsequent Q4 2022 report showed, the business has performed much better than I expected – so I have now decided to revise my assumptions again.
Despite falling prices and an apparent cooling of demand in China and globally, Tesla beat the EPS consensus forecast [by 7.28%] for the 8th consecutive quarter.
On Feb. 1, 2023, Goldman Sachs’ U.S. Autos & Industrial Tech team released a report [proprietary source] on how the automotive industry and some manufacturing companies, in particular, are doing in the U.S. market. According to GS estimates, Tesla has increased its share of the U.S. light vehicle market from 3.9% to 5% over the past year, while finished vehicle inventory in that market remains below historical levels – a clear bullish sign for TSLA investors and an excellent reason to note how the cuts in selling prices are making a positive impact on sales.
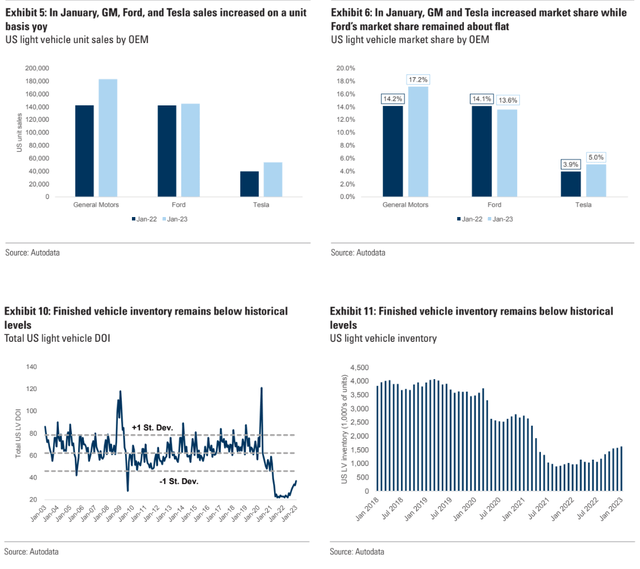
Feb. 1, 2023, Goldman Sachs’ U.S. Autos & Industrial Tech team
Tyler Durden from ZeroHedge gave interesting figures a few days after the publication of that GS report. Based on Visual Capitalist’s data, Tyler notes that Tesla is the absolute leader among its competitors in terms of net profit [and so gross profit and EBIT] per car sold.
It seems like Tesla’s hard work is paying off. The company, known for having trouble keeping up with demand in the past, has seen a major decrease in its order backlog. In just a matter of months, the backlog has gone from a whopping 476,000 units in July 2022 to a much smaller 74,000 units by December 2022. This decrease can be credited to Tesla’s incredible production growth, which saw a 41% increase from 2021 to 2022.
I cannot update my model by just tweaking the exit multiple or the WACC part – I have to take into account the positive part of the company’s resilience. I decided to stick to consensus revenue growth data; I expect the EBITDA margin to be 8.5% in FY2023 and gradually increase to 15% by E2026. According to my calculations, the EBIT margin will be affected by the upcoming slowdown in the economy, but it will then grow quite actively [1% in FY2023 -> 10% in FY2026].
The ratios for working capital – including the ratio of receivables to sales, inventories to sales, and payables to sales – appear to be fairly steady and can be predicted for several years into the future without significant changes, based on the average figures. The ratio of CAPEX to sales is a crucial factor, as it greatly impacts the generation of FCF. In the past, this ratio showed a lot of variabilities, but as Tesla has grown, the ratio has steadily decreased. If there is a recession in late 2023, I anticipate that the ratio of CAPEX to sales will drop even further, possibly to as low as 7%. However, I expect it to rebound in 2024 to 8% and gradually reach 9% by E2026 as production continues to increase. Given all that, I am not making any alterations to my previous CAPEX and NWC predictions.
Just like last time, I calculate my WACC based on the CAPM model. But now my inputs shifted a little bit:
- beta = 2.03;
- cost of debt = 8%;
- tax rate = 12.99%;
- risk-free rate = 3.5%;
- cost of equity = 4.5%.
So my WACC is only 0.3% higher than JPM’s – 12.55%. In my opinion, this is a very reasonable discount rate for the risk investors take in buying Tesla shares.
However, I have decided to increase the exit EV/EBITDA multiple from 12x to 15x so that my valuation model takes into account the hopes of all investors for abnormal growth in the post-forecast period [which will start in only 4 forecast years].
Here’s the output table I’ve got:
|
discount periods |
1 | 2 | 3 | 4 |
|
FCFF |
$2,521 | $6,566 | $11,289 | $15,634 |
|
EBITDA |
$8,722 | $13,343 | $17,432 | $28,012 |
|
WACC |
12.55% | |||
|
PV of FCFF |
$2,240 | $5,184 | $7,918 | $9,743 |
|
Sum of PV (FCFF) |
$25,084 | |||
|
EV/EBITDA exit multiple |
15x | |||
| Terminal Value, based on EV/EBITDA multiple = | $420,177 | |||
| Total Enterprise value = | $445,261 | |||
|
share of FCFF [% of total EV] = |
5.63% | |||
|
share of Terminal value [% of total EV] = |
94.37% | |||
|
Net debt = |
$-16,437 | |||
|
Equity Value = |
$461,698 | |||
|
per share = |
$133.85 | |||
|
current price = |
$196.89 | |||
|
upside/downside, % |
-32.02% | |||
Source: Author’s calculations.
As you can see, my “fair” price target doubled from $98.53 to $196.89 per share. However, the overvaluation has increased by a factor of ~2.5, as TSLA has already made strong gains in recent weeks.
It is nice to see that the results of my valuation – despite the rather simple approach of modeling – are around the 60-70% percentile, according to Aswath Damodaran’s model. This means that I may be not very far from reality.
Also, the fact that Tesla’s rally was so fast is not just my opinion. Analysts at Morgan Stanley, whose assumptions I discussed in great detail in one of my earlier Tesla articles, have noted that the recent rally severely limits the upside potential of TSLA stock in the near term [proprietary source]. The bulls will need a lot more tailwinds and positive news to keep the stock on the upswing:
![Morgan Stanley [02/09/2023]](https://static.seekingalpha.com/uploads/2023/2/13/49513514-16762844656351287.png)
Morgan Stanley [02/09/2023] + author’s notes
The Verdict
The market’s feeling pretty greedy right now, according to CNN’s Fear & Greed Index – and it looks like Tesla buyers have been driving the recent stock rally. But when the market even hints at slowing down, these buyers are likely to bail and take their profits. The normal relationship between Tesla and the overall market has gone haywire, which probably won’t stick around for long. When the bears get the chance, it looks like Tesla stock will be the first to take a nosedive. Technical signals and a huge divergence from the stock’s “fair value” are already showing this risk.
However, I may be wrong on all points of my analysis. If, for example, the February figures CPI turn out better than expected, the markets could receive additional growth impetus – investors now have enough cash to spend. Another risk to my thesis is the subjectivity of technical analysis and valuation. Everyone reads and analyzes charts differently, and different time frames lead to different conclusions. On the monthly chart, TSLA is far from being overbought, and even more – it may seem like a great buy right now.
![TrendSpider, TSLA [monthly], author's notes](https://static.seekingalpha.com/uploads/2023/2/13/49513514-16762852982872312.png)
TrendSpider, TSLA [monthly], author’s notes
The Morningstar’s system disagrees with my fair value conclusions – it thinks TSLA is ~12% undervalued even after its big rally:
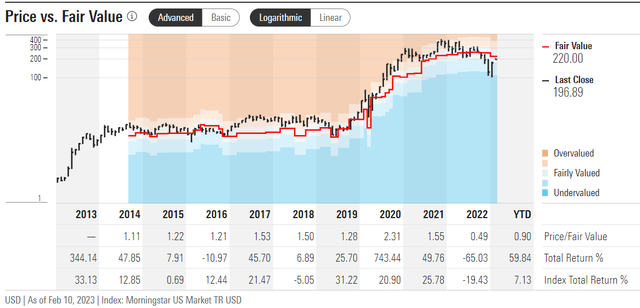
Morningstar Premium
Even though I’ve doubled my price target, I still think Tesla, Inc. is more likely to see a big sell-off now compared to a few weeks ago or the last time I wrote about the company. I’m keeping my Hold [Neutral] rating but can’t suggest buying TSLA because of the reasons mentioned above. I believe that in 2023, investors will have even better chances to buy this stock for a lot cheaper.
Thanks for reading!
Disclosure: I/we have no stock, option or similar derivative position in any of the companies mentioned, and no plans to initiate any such positions within the next 72 hours. I wrote this article myself, and it expresses my own opinions. I am not receiving compensation for it (other than from Seeking Alpha). I have no business relationship with any company whose stock is mentioned in this article.
