
Summary:
- Meta Platforms, Inc. announced a whopping $40 billion share repurchase program.
- In 2022, Meta repurchased 160 million shares worth $27.9 billion.
- Its competitor, Pinterest, Inc. also announced a $500 million share buyback last week.
Kira-Yan
Tech giant, Meta Platforms, Inc. (NASDAQ:META), with a $482.4 billion market cap, announced a whopping $40 billion share repurchase program representing around 10% of its market cap at announcement on February 1, 2023. Its competitor, Pinterest, Inc. (PINS) also announced a $500 million share buyback this week representing less than 3% of its market cap at announcement.
Buyback activity edged up a bit as companies have started reporting their Q4 2022 earnings. A total of 17 companies announced buybacks last week compared to 13 companies in the prior week. Eight of these 17 companies announced buybacks that equaled or crossed the $1 billion mark. ON Semiconductor Corporation (ON) and Vertex Pharmaceuticals (VRTX) announced $3 billion buybacks each representing around 9% and 4% of their market caps at announcement respectively.
Meta Platforms, Inc.
Strong Financials & Profitability:
Meta has been an interesting story over the last year as concerns over advertising spending during a recession hit the entire social media group of companies hard. Meta was especially hard hit because of what was perceived as uncontrolled spending on a virtual universe project with uncertain prospects. After a more than 75% peak-to-trough decline, the stock has more than doubled from its November 2022 lows. Investors have taken solace in the fact that tech companies are reigning in spending and the stock also benefited from a rebound in technology stocks from oversold conditions. Despite this rebound, the stock is still down 13% over the last year.
Meta’s balance sheet looks strong with over $30 billion in net cash (not accounting for capital leases) at the end of December 2022. Cash generated by the company for trailing twelve months was $5.47 billion. With gross profit margin of around 80%, net income margin of 20%, return on equity of around 19% and a forward EV/EBITDA under 9, I can see why the company wants to buy back its stock despite the recent rebound in the stock. Fifteen analysts revised their earnings estimates upwards for Meta over the last 90 days.
Share Buybacks:
Meta has been buying back its shares quite consistently since the fourth quarter of 2021. Since early 2019, Meta Platforms has reduced its number of outstanding shares by 6%. In 2022, the company repurchased 160 million shares worth $27.9 billion. In the fourth quarter alone, the company repurchased $6.9 billion of its Class A common stock, with $10.9 billion remaining under a prior authorization to buy stock.
Meta Platforms Inc. – Change in Shares Outstanding (InsideArbitrage)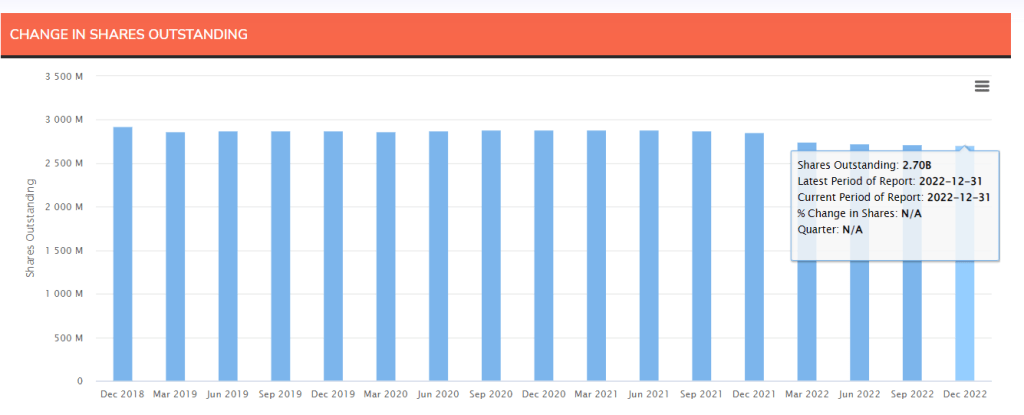
This decreasing in share outstanding indicates that Meta is not just announcing buybacks to offset dilution from stock-based compensation for employees. It is actually buying back its stock to return value to shareholders.
Apple vs. Meta:
The other tech giant, Apple Inc. (AAPL) announced successive $90 billion buybacks in 2021 and 2022. Apple has been repurchasing shares on a regular basis, reducing its shares outstanding count consistently quarter over quarter over the past 5 years.
It has been engaged in a massive stock buyback program, having bought back nearly $90 billion worth of its shares in fiscal 2022. Since the program began in fiscal 2013, Apple has spent more than $550 billion in stock buybacks, more than any other U.S. company. In the December quarter, the company returned $19 billion to shareholders through open market repurchases of 133 million Apple shares.
Apple Inc. – Change in Shares Outstanding (InsideArbitrage)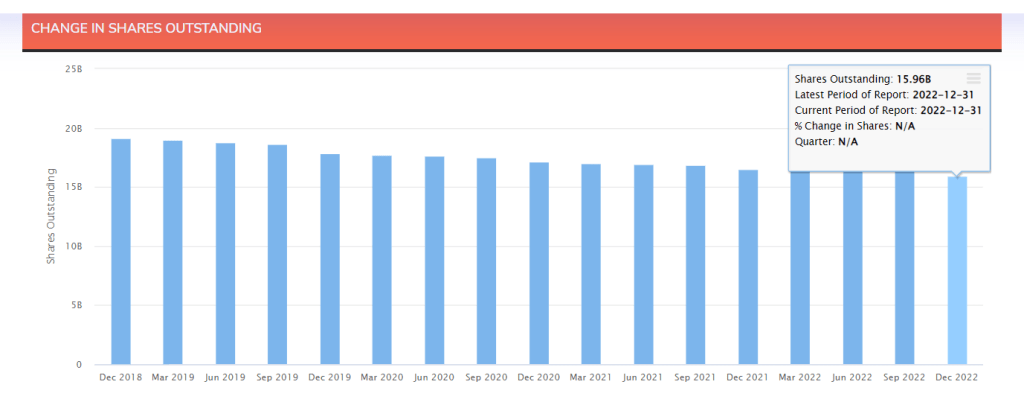
It is quite clear that buyback announcements by Apple are also followed by actual stock repurchases just like Meta. But Apple shows a more consistent buyback pattern compared to Meta and can be considered an “uber cannibal”.
Meta Q4, 2022 results:
Last year was not the best for Meta with most metrics showing a decline compared to the prior year. In Q4, the company made the difficult decision to lay off employees while reprioritizing certain projects and curtailing non-headcount related expenses.
In fiscal 2022, revenue declined slightly from $117.9 billion in the previous year to $116.6 billion – a decline of 1.1% year-over-year. Income from operations declined a whopping 38.1% from $46.7 billion in fiscal 2021 to $28.9 billion in fiscal 2022, and diluted earnings per share declined 37.6% year-over-year from $13.77 in fiscal 2021 to $8.59 in fiscal 2022.
This decline was mainly due to the increased costs for research and development, which rose by 43% from $24.66 billion in fiscal 2021 to $35.34 billion in fiscal 2022. Free cash flow also declined 52% year-over-year from $38.4 billion in fiscal 2021 to $18.4 billion in fiscal 2022.
Meta- Quarterly comparison of family monthly active people (Meta) Meta- Quarterly comparison of family daily active people (Meta)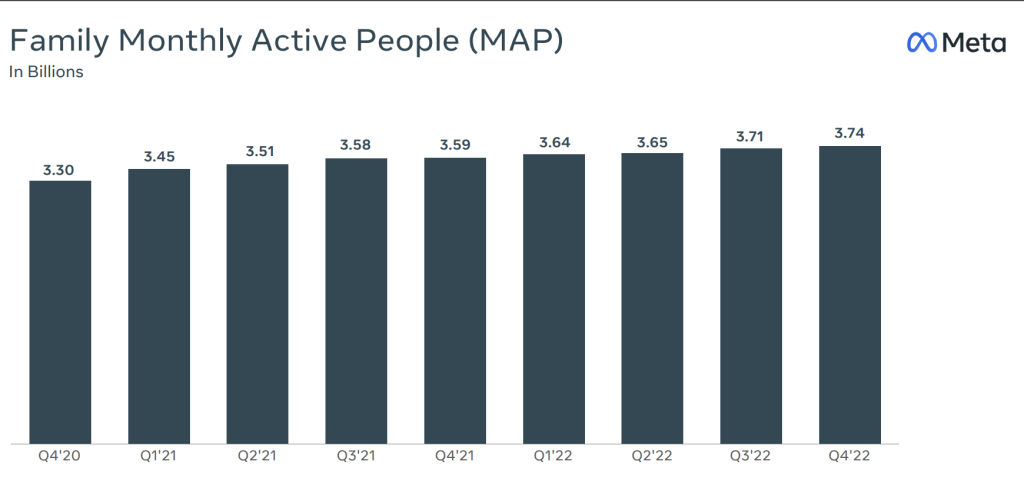
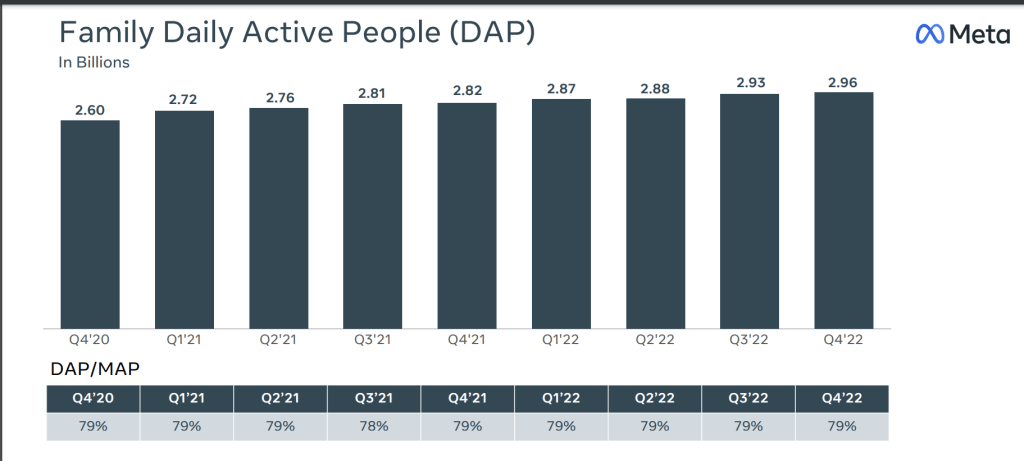
The company’s successful performance in Q4 proved all rumors wrong about the decline in popularity of Facebook and Instagram.
During the quarter, Facebook’s daily active users were 2 billion. Compared to the same quarter last year, this was an increase of 4.1% YoY. The number of people using Facebook, Instagram and WhatsApp is the highest it has ever been. Meta recorded a total of 2.96 billion daily active people and 3.74 billion monthly active people across all of its apps, clearly indicating the popularity of its apps like Facebook, Instagram and WhatsApp. It also announced a forecasted decrease in total expenses and capital expenditures this year because of various optimization efforts taken by the company.
2023 Outlook:
Looking at the revenue outlook, the company expects first quarter 2023 total revenue to be in the range of $26 billion to $28.5 billion. It anticipates full-year 2023 total expenses to be in the range of $89 billion to $95 billion, lower than its prior outlook of $94 billion to $100 billion. The company expects to record an estimated $1 billion in restructuring charges in 2023 related to consolidating its office facilities footprint. This is down from its prior estimate of $2 billion. Turning to CapEx outlook for 2023, Meta expects capital expenditures to be in the range of $30 billion to $33 billion, lowered from its prior estimate of $34 billion to $37 billion.
The Bottom Line:
Meta’s recent investments in expanding its AI capabilities could help the company to improve its performance and help advertisers grow their businesses.
Speaking of his goals for Meta, Mark Zuckerberg, said, “And one of my goals for Meta is to build on our research to become a leader in generative AI in addition to our leading work in recommendation AI. Later this year, we are going to launch our next-generation consumer headset, which will feature Meta Reality as well. And I expect that this is going to establish this technology as the baseline for all headsets going forward and eventually, of course, for AR glasses as well.“
Both Reels and messaging ads continue to outperform expectations which could lead to generating additional revenue. A further monetization of Reels and WhatsApp along with its AI tools could help Meta achieve its desired growth in the following quarters.
Welcome to edition 45 of Buyback Wednesdays, a weekly series that tracks the top stock buyback announcements during the prior week. The companies in the list below are the ones that announced the most significant buybacks as a percentage of their market caps. They are not the largest buybacks in absolute dollar terms. A word of caution. Some of these companies could be low-volume small-cap or micro-cap stocks with a market cap below $2 billion.
Top 5 Stock Buyback Announcements
1. PGT Innovations, Inc. (PGTI): $23.38
On February 7, 2023, the Board of Directors of this premium windows and doors manufacturer, authorized a $250 million share repurchase program, equal to 18.8% of its market cap at announcement.
| Market Cap: $1.33B | Avg. Daily Volume (30 days): 274,527 | Revenue (TTM): $1.46B |
| Net Income Margin (TTM): 7.25% | ROE (TTM): 17.85% | Net Debt: $507.88M |
| P/E: 13.14 | Forward P/E: N/A | EV/EBITDA (TTM): 8.18 |
2. PharmaCyte Biotech, Inc. (PMCB): $2.9
On February 2, 2023, the Board of Directors of this biotechnology company, approved a $10 million share repurchase program equal to 17.9% of its market cap at announcement.
| Market Cap: $56.18M | Avg. Daily Volume (30 days): 78,649 | Revenue (TTM): N/A |
| Net Income Margin (TTM): N/A | ROE (TTM): -6.54% | Net Cash: $76.96M |
| P/E: N/A | Forward P/E: N/A | EV/EBITDA (TTM): N/A |
3. Arrow Electronics Inc. (ARW): $131.28
On February 2, 2023, the Board of Directors of this products, services, and solutions provider, authorized an additional share repurchase program of up to $1 billion of its common stock, equal to 12.2% of its market cap at announcement.
| Market Cap: $7.98B | Avg. Daily Volume (30 days): 485,478 | Revenue (TTM): $37.12B |
| Net Income Margin (TTM): 3.84% | ROE (TTM): 26.21% | Net Debt: $3.60B |
| P/E: 6.08 | Forward P/E: N/A | EV/EBITDA (TTM): 5.13 |
4. Skyworks Solutions, Inc. (SWKS): $122.97
On February 6, 2023, the Board of Directors of this semiconductor company authorized a new repurchase of $2 billion of the company’s Class A common stock, equal to 11.5% of its market cap at announcement.
| Market Cap: $17.50B | Avg. Daily Volume (30 days): 760,503 | Revenue (TTM): $5.49B |
| Net Income Margin (TTM): 23.25% | ROE (TTM): 23.69% | Net Debt: $1.83B |
| P/E: 14.42 | Forward P/E: 10.96 | EV/EBITDA (TTM): 9.54 |
5. Meta Platforms, Inc.: $191.62
On February 1, 2023, the Board of Directors of this social media company authorized a new $40 billion stock buyback program, representing around 10% of its market cap at announcement.
| Market Cap: $482.39B | Avg. Daily Volume (30 days): 37,662,190 | Revenue (TTM): $116.61B |
| Net Income Margin (TTM): 19.90% | ROE (TTM): 18.52% | Net Cash: $13.33B |
| P/E: N/A | Forward P/E: N/A | EV/EBITDA (TTM): 11.10 |
Editor’s Note: This article covers one or more microcap stocks. Please be aware of the risks associated with these stocks.
Disclosure: I/we have a beneficial long position in the shares of VRTX, META either through stock ownership, options, or other derivatives. I wrote this article myself, and it expresses my own opinions. I am not receiving compensation for it. I have no business relationship with any company whose stock is mentioned in this article.
Additional disclosure: Voluntary Disclosure: I hold long positions in Vertex Pharmaceuticals (VRTX) and Meta Platforms (META).
A Combination Of Tools And Analysis For Event-Driven Strategies.
For over a decade we built tools to help event-driven investors that focus on strategies like merger arbitrage. The Inside Arbitrage service provides the best combination of tools and analysis for various event-driven strategies like risk arbitrage, spinoffs and SPACs.
We also track insider purchases and companies that are buying back their own stock while their insiders are making open market purchases. We use these strategies for idea generation and then do detailed work to identify opportunities for our model portfolio and personal portfolios. Click here to learn more.